To become a Data Scientist in 6 months, allocate time for learning key skills and practical projects. Follow a structured roadmap with dedicated resources and timelines.
Starting a career in data science requires a well-planned roadmap and disciplined study schedule. A six-month timeline demands focused learning on essential topics such as programming, statistics, machine learning, and data visualization. Aspiring data scientists should leverage online courses, books, and hands-on projects to solidify their knowledge.
Consistency and practical application of skills are crucial to mastering data science within this period. This guide details each step and recommends resources to ensure a comprehensive learning experience, equipping you with the necessary skills to excel in the field.
Credit: encord.com
Understanding The Role Of A Data Scientist
Understanding the role of a data scientist is crucial for anyone aiming to dive deep into the data science field. Data scientists are the experts who analyze complex data to help organizations make informed decisions. They use various tools and techniques to extract insights from data, making them invaluable in today’s data-driven world. Below, we will explore the skills and responsibilities of a data scientist and the importance of data science in various industries.
Skills And Responsibilities Of A Data Scientist
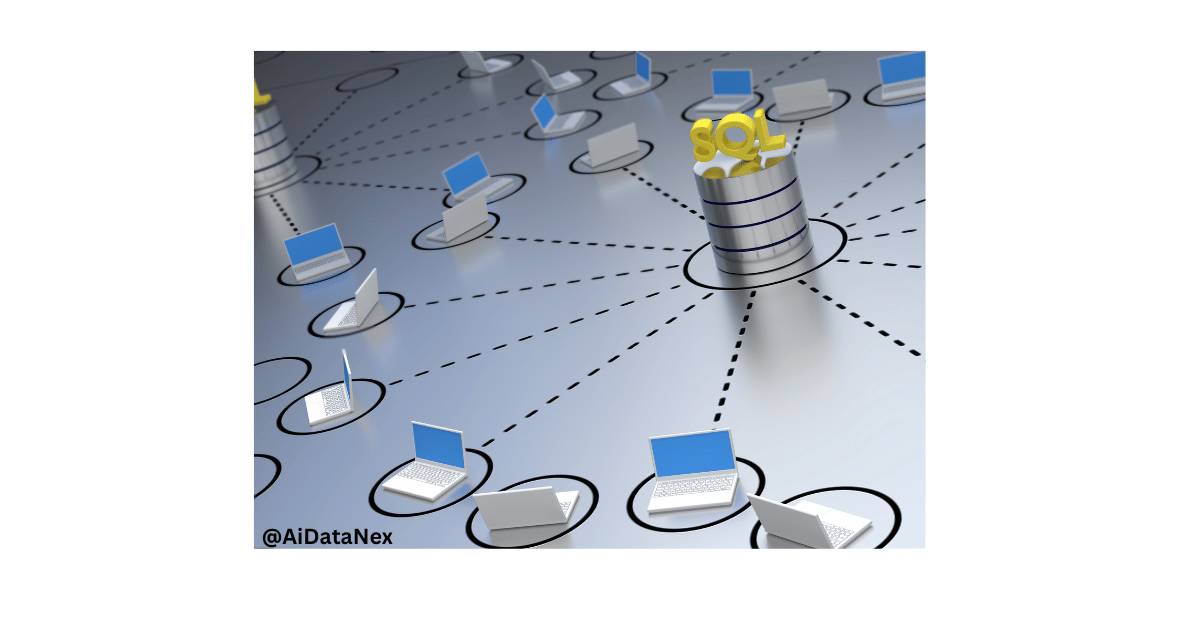
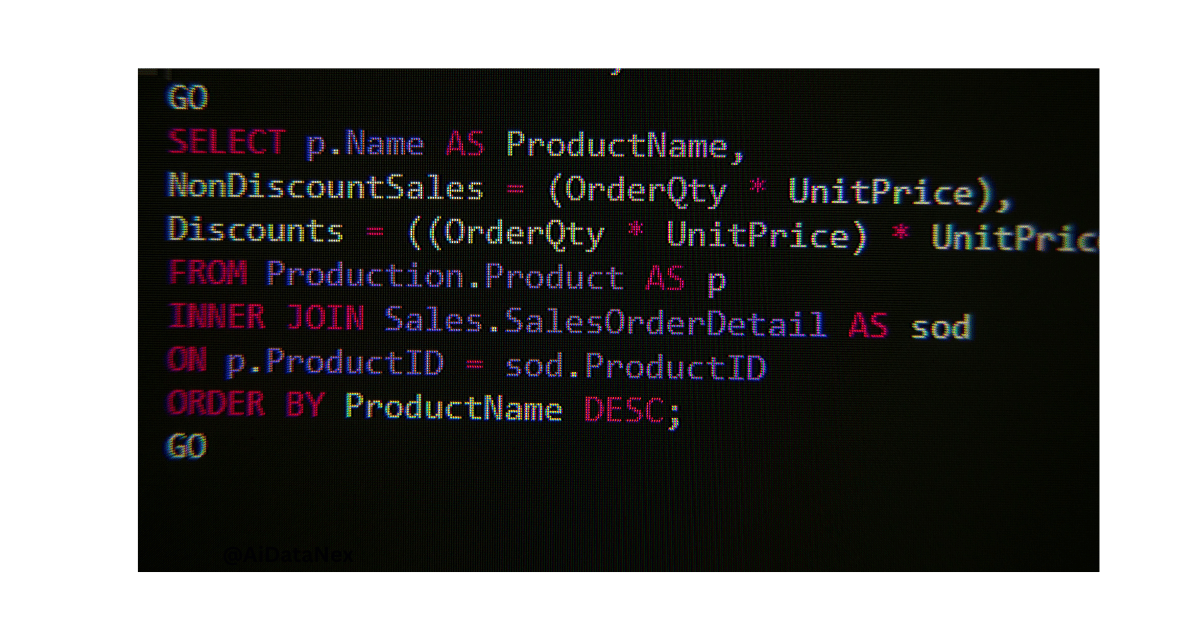
A data scientist must possess a blend of technical skills and soft skills. They need to be proficient in programming languages like Python and R, which are essential for data manipulation and analysis. Additionally, they should be familiar with SQL for database management and querying.
Here are some key skills and responsibilities of a data scientist:
- Data Cleaning: Ensuring data quality by identifying and correcting errors in the dataset.
- Data Visualization: Creating visual representations of data to communicate insights effectively.
- Statistical Analysis: Applying statistical methods to analyze and interpret data.
- Machine Learning: Building predictive models using algorithms.
- Big Data Technologies: Working with tools like Hadoop and Spark to handle large datasets.
Besides technical skills, data scientists need to have strong problem-solving skills and the ability to work in teams. They often collaborate with other departments to understand the business needs and tailor their analysis accordingly.
Below is a table summarizing the essential skills and tools:
| Skill | Tools/Technologies |
|---|---|
| Programming | Python, R |
| Database Management | SQL |
| Data Visualization | Tableau, Matplotlib |
| Machine Learning | Scikit-learn, TensorFlow |
| Big Data | Hadoop, Spark |
Importance Of Data Science In Various Industries
Data science is transforming industries by providing actionable insights and automating processes. In the healthcare sector, data science helps in predicting disease outbreaks, personalizing treatments, and improving patient care.
In the finance industry, data scientists analyze market trends, detect fraud, and optimize investment portfolios. They use predictive models to forecast market movements and advise clients on the best investment strategies.
The retail sector leverages data science to understand consumer behavior, optimize inventory, and enhance customer experiences. Retailers use data analytics to personalize recommendations and improve supply chain efficiency.
In manufacturing, data science plays a pivotal role in predictive maintenance, quality control, and supply chain optimization. Manufacturers use data analytics to predict equipment failures and reduce downtime.
Below is a list of industries and their key data science applications:
- Healthcare: Predictive analytics, personalized medicine, patient care improvement.
- Finance: Market analysis, fraud detection, investment optimization.
- Retail: Consumer behavior analysis, inventory management, customer experience enhancement.
- Manufacturing: Predictive maintenance, quality control, supply chain optimization.
Data science is also making waves in transportation, where it helps in route optimization, traffic management, and autonomous driving technologies. In entertainment, data scientists analyze viewer preferences to recommend content and improve user engagement.
Understanding the varied applications of data science across industries highlights its growing importance. Businesses are increasingly relying on data-driven insights to stay competitive and innovate.

Credit: sproutsocial.com
Building A Strong Foundation
Embarking on a journey to become a Data Scientist in just 6 months is ambitious but achievable. The first step in this transformative journey is building a strong foundation. This foundation is critical for mastering advanced concepts later. Let’s break down the essentials you need to cover.
Basics Of Statistics And Probability
Understanding the basics of statistics and probability is crucial. These concepts form the backbone of data science. You need to spend around 4 weeks mastering these topics. Here are some key areas to focus on:
- Descriptive Statistics: Learn about mean, median, mode, variance, and standard deviation.
- Inferential Statistics: Understand hypothesis testing, confidence intervals, and p-values.
- Probability: Study probability distributions, Bayes’ theorem, and conditional probability.
Here are some recommended resources:
| Resource | Type | Link |
|---|---|---|
| Statistics for Data Science Course | Online Course | Coursera |
| Think Stats | Book | Green Tea Press |
Introduction To Programming
The next step is to get comfortable with programming. Spend around 6 weeks learning Python, the most popular language for data science. Here are some key topics to cover:
- Basic Syntax: Variables, data types, and operators.
- Control Structures: Loops, conditionals, and functions.
- Libraries: Get familiar with NumPy, Pandas, and Matplotlib.
Here are some recommended resources:
| Resource | Type | Link |
|---|---|---|
| Python for Everybody | Online Course | Coursera |
| Automate the Boring Stuff with Python | Book | Automate the Boring Stuff |
Data Manipulation And Cleaning
Data manipulation and cleaning are essential skills. Spend around 4 weeks learning how to handle and preprocess data. Here are some key areas to focus on:
- DataFrames: Learn how to manipulate data using Pandas DataFrames.
- Missing Values: Understand how to handle missing data.
- Data Transformation: Learn techniques for data normalization and transformation.
Here are some recommended resources:
| Resource | Type | Link |
|---|---|---|
| Pandas Documentation | Online Documentation | Pandas |
| Data Science Handbook | Book | Python Data Science Handbook |
Mastering Machine Learning Algorithms
Becoming a data scientist in 6 months is an achievable goal with a well-structured roadmap. One of the critical areas to master is machine learning algorithms. Machine learning is the heart of data science, enabling systems to learn from data and make predictions or decisions. This section will cover the essentials of mastering machine learning algorithms, including supervised learning, unsupervised learning, and reinforcement learning. Each subsection will guide you through the concepts, resources, and estimated time needed for mastery.
Supervised Learning
Supervised learning is fundamental in machine learning. It involves training a model on a labeled dataset, meaning that each training example is paired with an output label. This process is used for tasks like classification and regression.
Key Concepts:
- Regression: Predicting continuous values (e.g., house prices).
- Classification: Categorizing data into classes (e.g., spam detection).
- Overfitting and Underfitting: Understanding model performance.
Recommended Resources:
- Books: “Pattern Recognition and Machine Learning” by Christopher Bishop.
- Online Courses: Coursera’s “Machine Learning” by Andrew Ng.
- Blogs and Articles: Towards Data Science, Analytics Vidhya.
Time Required: Approximately 4-5 weeks.
Unsupervised Learning
Unsupervised learning deals with unlabeled data. The goal is to model the underlying structure or distribution in the data to learn more about it. This is particularly useful for clustering, association, and dimensionality reduction.
Key Concepts:
- Clustering: Grouping data points with similar characteristics (e.g., customer segmentation).
- Dimensionality Reduction: Reducing the number of random variables (e.g., Principal Component Analysis).
- Association: Finding rules that describe large portions of the data (e.g., market basket analysis).
Recommended Resources:
- Books: “Hands-On Unsupervised Learning Using Python” by Ankur A. Patel.
- Online Courses: Coursera’s “Unsupervised Machine Learning” by Stanford University.
- Blogs and Articles: KDnuggets, DataCamp.
Time Required: Approximately 3-4 weeks.
Reinforcement Learning
Reinforcement learning is a type of machine learning where an agent learns to make decisions by taking actions in an environment to maximize cumulative reward. It is used in areas like robotics, game playing, and self-driving cars.
Key Concepts:
- Agent: The learner or decision maker.
- Environment: The setting in which the agent operates.
- Policy: The strategy used by the agent to decide actions.
- Reward: The feedback from the environment.
Recommended Resources:
- Books: “Reinforcement Learning: An Introduction” by Richard S. Sutton and Andrew G. Barto.
- Online Courses: Udacity’s “Deep Reinforcement Learning Nanodegree.”
- Blogs and Articles: OpenAI blog, DeepMind blog.
Time Required: Approximately 4-5 weeks.
Exploring Advanced Data Science Techniques
Embarking on a journey to become a data scientist in six months is an exciting endeavor. This roadmap provides a structured path from the basics to advanced techniques. In this section, we delve into Exploring Advanced Data Science Techniques. Mastering these techniques is crucial for solving complex real-world problems and making data-driven decisions. Let’s explore three advanced areas: Deep Learning and Neural Networks, Natural Language Processing, and Time Series Analysis.
Deep Learning And Neural Networks
Deep Learning is a subset of machine learning focused on neural networks with many layers. These networks mimic the human brain’s ability to learn from vast amounts of data. Neural Networks are the backbone of many state-of-the-art algorithms used in image and speech recognition.
Here is a breakdown of what you need to learn:
- Introduction to Deep Learning: Understand the basic concepts and applications.
- Neural Network Architecture: Learn about layers, nodes, activation functions, and backpropagation.
- Building Neural Networks: Use frameworks like TensorFlow or PyTorch to build and train networks.
- Convolutional Neural Networks (CNNs): Specialize in image processing tasks.
- Recurrent Neural Networks (RNNs): Focus on sequential data like time series or text.
Here are some resources to get started:
| Resource | Description |
|---|---|
| Deep Learning Specialization by Andrew Ng | A comprehensive course on Coursera covering all aspects of deep learning. |
| TensorFlow Documentation | Official documentation and tutorials for TensorFlow. |
| PyTorch Tutorials | Official tutorials from the PyTorch team. |
Natural Language Processing
Natural Language Processing (NLP) is the field of study focused on the interaction between computers and human languages. NLP techniques are used in applications like chatbots, sentiment analysis, and language translation.
Key topics to cover in NLP:
- Text Preprocessing: Techniques like tokenization, stemming, and lemmatization.
- Word Embeddings: Methods like Word2Vec and GloVe to represent words as vectors.
- Sequence Models: RNNs, LSTMs, and GRUs for handling sequential data.
- Transformers: The architecture behind models like BERT and GPT-3.
- Sentiment Analysis: Analyzing and classifying emotions in text.
Recommended resources:
| Resource | Description |
|---|---|
| Natural Language Processing with Python | A book by Steven Bird, Ewan Klein, and Edward Loper. |
| Coursera’s NLP Specialization | Courses covering the basics to advanced NLP techniques. |
| Hugging Face’s Transformers Documentation | Official documentation for the Transformers library. |
Time Series Analysis
Time Series Analysis involves analyzing data points collected or recorded at specific time intervals. This technique is essential for forecasting and understanding temporal patterns.
Essential topics in Time Series Analysis:
- Introduction to Time Series: Basic concepts and terminology.
- Statistical Methods: Techniques like ARIMA and exponential smoothing.
- Decomposition: Separating a time series into trend, seasonal, and residual components.
- Advanced Models: Using machine learning models like Prophet and LSTM for forecasting.
- Evaluation Metrics: Measuring the accuracy of time series models.
Useful resources:
| Resource | Description |
|---|---|
| Introduction to Time Series Analysis | A book by Jonathan D. Cryer and Kung-Sik Chan. |
| Forecasting: Principles and Practice | A free online book by Rob J Hyndman and George Athanasopoulos. |
| Prophet Documentation | Official documentation for Facebook’s Prophet library. |
Gaining Practical Experience
Becoming a data scientist in six months is a challenging yet achievable goal. Following a detailed roadmap from A to Z, including practical experience, is crucial. Gaining practical experience is essential for a data scientist. It bridges the gap between theory and practice. This section outlines the steps to gain hands-on experience in data science.
Working With Real-world Datasets
Working with real-world datasets is crucial for aspiring data scientists. Real-world data is often messy and complex. Learning to handle this data is vital. Begin by exploring open datasets available online:
Spend 2 weeks working on these datasets. Practice cleaning, transforming, and visualizing data. Use tools like Pandas and NumPy. Here is an example code snippet to get you started:
import pandas as pd

# Load dataset
df = pd.read_csv('your_dataset.csv')

# Data Cleaning
df.dropna(inplace=True)
df['column'] = df['column'].str.lower()
Try to understand the domain of each dataset. This helps in feature engineering. Collaborate with peers to gain different perspectives. Document your work. This builds your portfolio. Ensure to spend time on at least three different datasets.
Data Visualization
Data visualization is an essential skill for data scientists. It helps in understanding data patterns and communicating insights. Start with basic visualizations using tools like Matplotlib and Seaborn. Here’s how you can create a simple plot:
import matplotlib.pyplot as plt
import seaborn as sns

# Simple plot
plt.figure(figsize=(10, 6))
sns.histplot(df['column'])
plt.title('Histogram of Column')
plt.show()
Spend 1 week mastering basic plots. Move on to advanced visualizations using Plotly and Tableau. Create interactive dashboards. These are useful in real-world scenarios. Here is an example of an interactive plot with Plotly:
import plotly.express as px

fig = px.scatter(df, x='column1', y='column2', color='column3')
fig.show()
Document your visualizations. Create a portfolio of at least five different visualizations. This showcases your ability to understand and present data effectively.
Model Evaluation And Validation
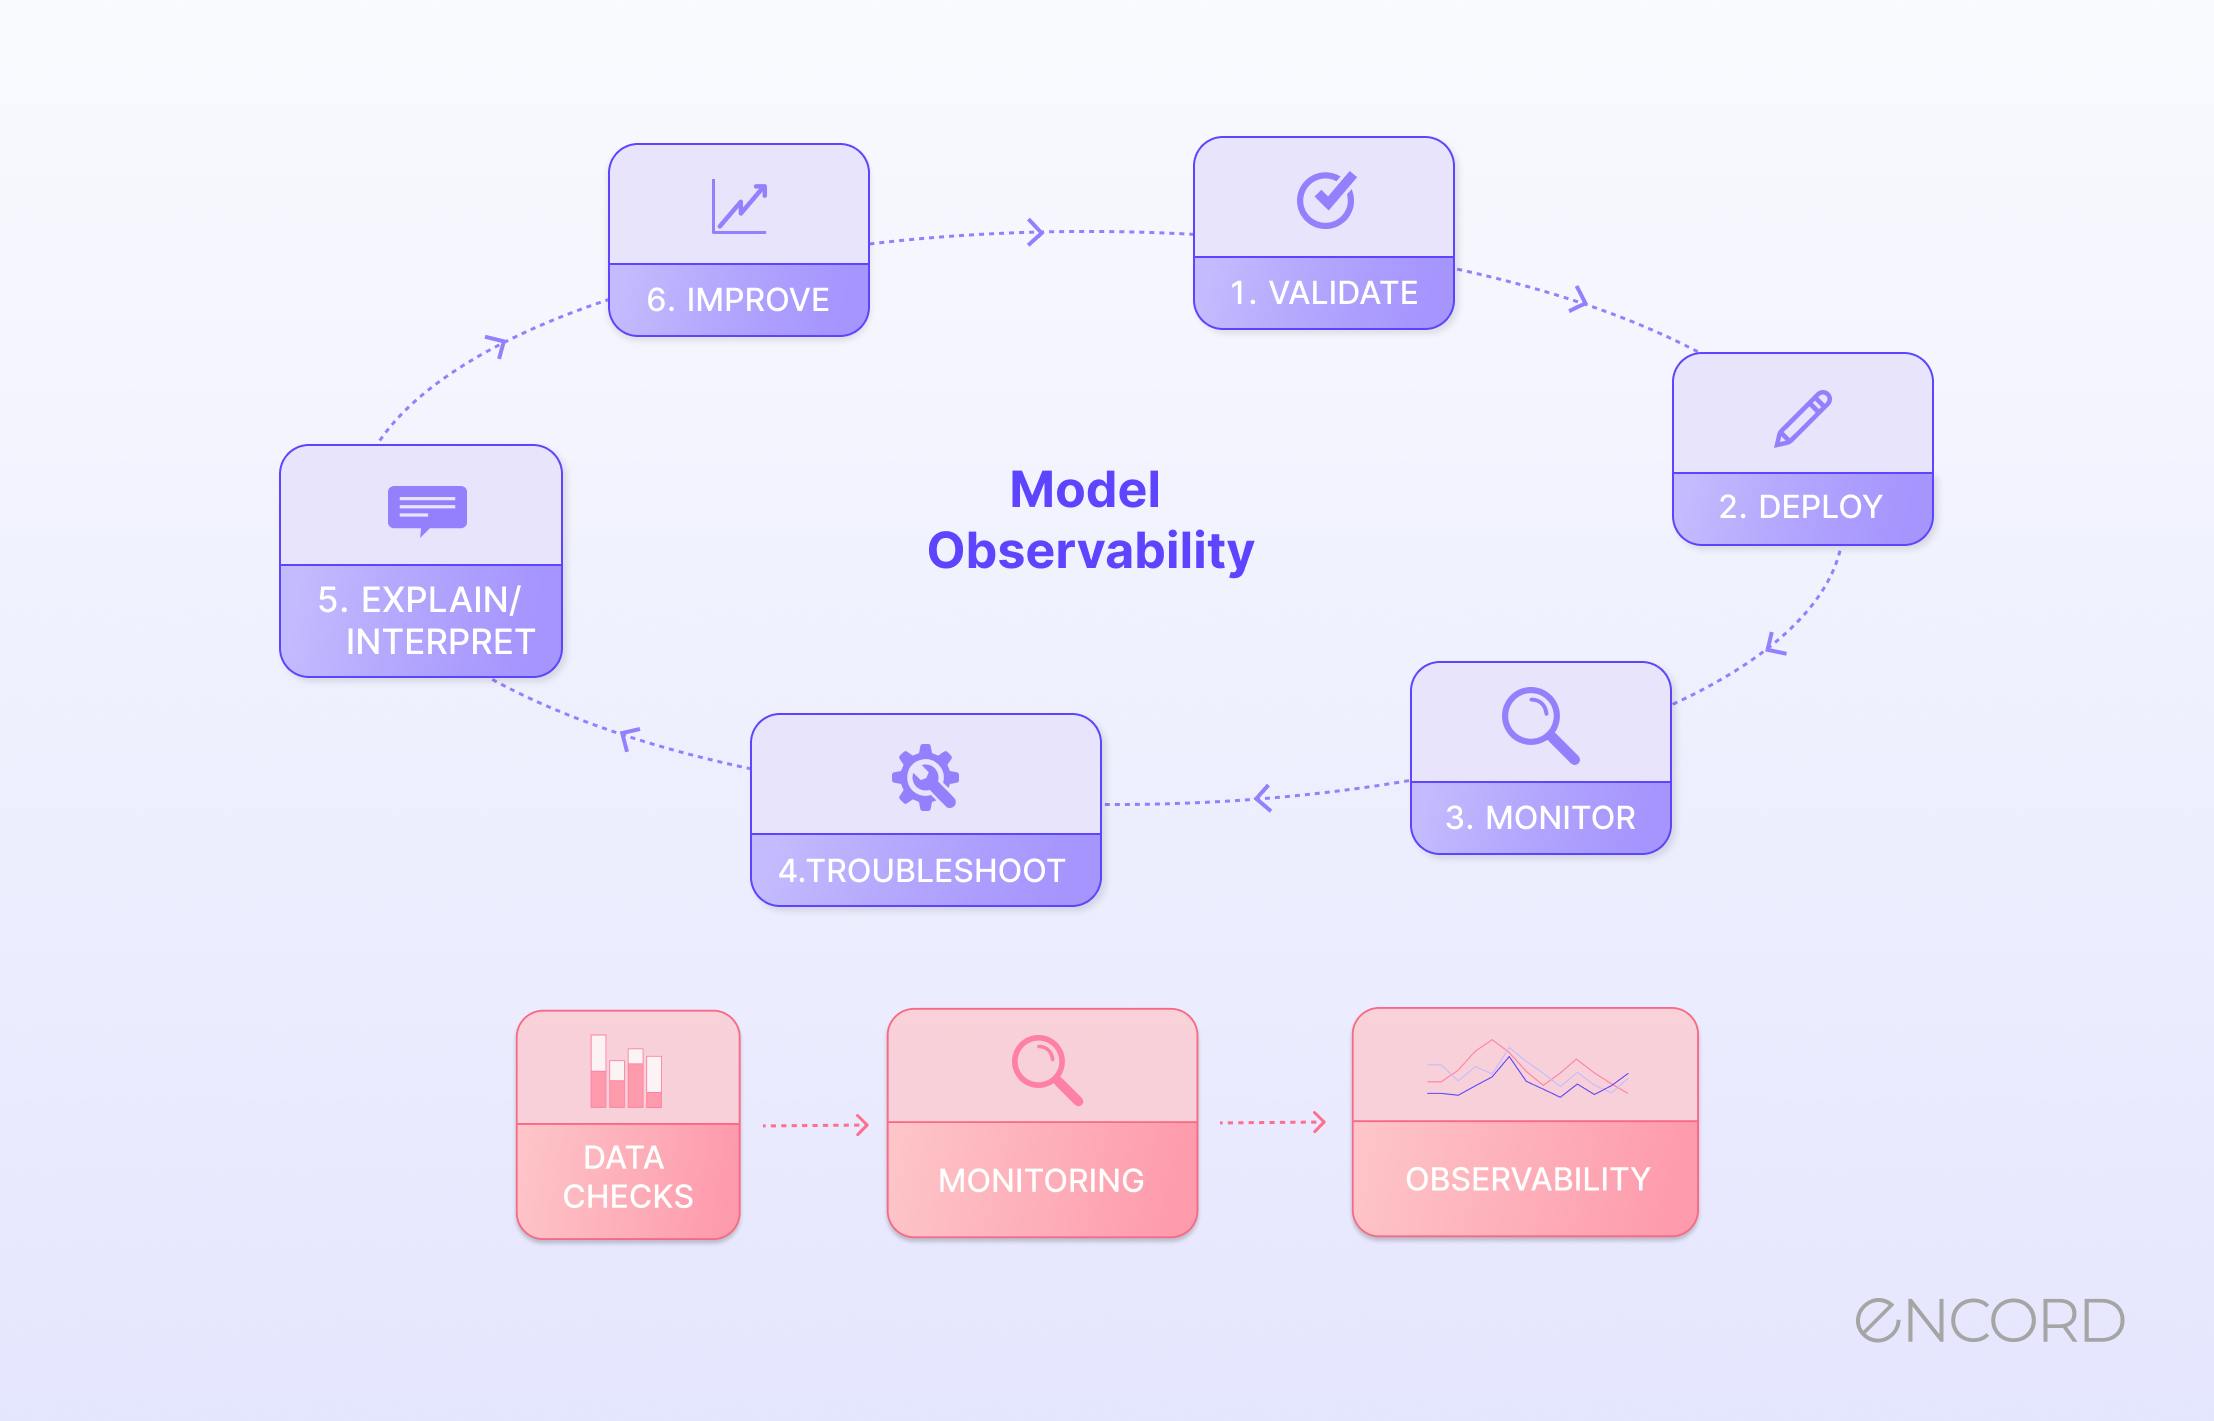
Model evaluation and validation are critical steps in the data science process. They ensure the accuracy and reliability of your models. Start with basic evaluation metrics like accuracy, precision, and recall. Here’s how you can calculate these metrics:
from sklearn.metrics import accuracy_score, precision_score, recall_score

# Assuming y_true and y_pred are your true and predicted labels
accuracy = accuracy_score(y_true, y_pred)
precision = precision_score(y_true, y_pred)
recall = recall_score(y_true, y_pred)

print(f'Accuracy: {accuracy}, Precision: {precision}, Recall: {recall}')
Spend 1 week learning and implementing these metrics. Move on to advanced techniques like cross-validation and A/B testing. Here is an example of cross-validation:
from sklearn.model_selection import cross_val_score
from sklearn.ensemble import RandomForestClassifier

model = RandomForestClassifier()
scores = cross_val_score(model, X, y, cv=5)

print(f'Cross-Validation Scores: {scores}')
Document the results of your evaluations. Compare different models. Choose the best-performing model. This practice is crucial for real-world applications. Aim to evaluate and validate at least three different models during your learning journey.
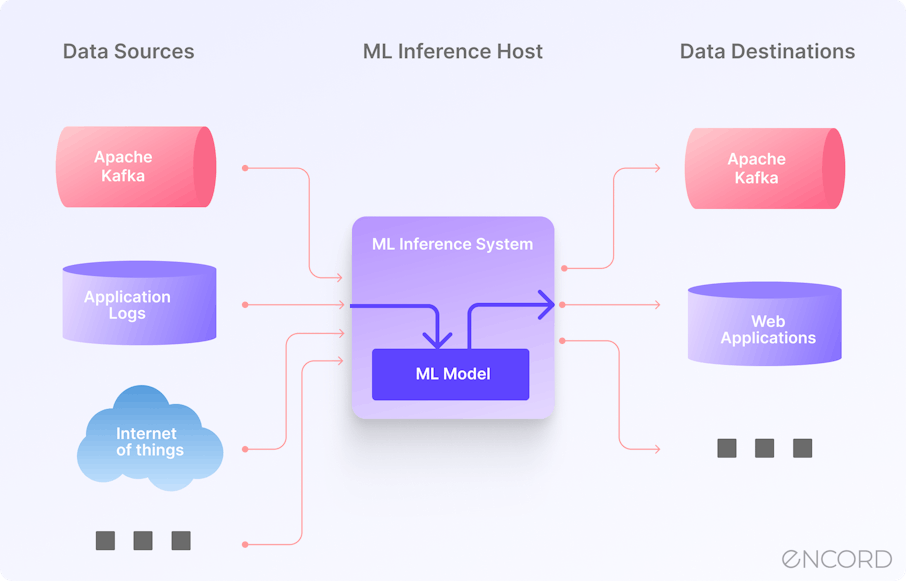
Credit: encord.com
Leveraging Big Data Technologies
In your journey to becoming a data scientist within six months, leveraging big data technologies is crucial. These technologies enable you to handle vast amounts of data efficiently and derive meaningful insights. This roadmap will guide you through the essential components of big data, including Hadoop, Spark, and data streaming and processing, along with the time required for each step.
Introduction To Big Data
Big Data refers to the massive volumes of data generated from various sources. Understanding Big Data is essential for a data scientist. It encompasses structured, unstructured, and semi-structured data. This step will take approximately two weeks.
Key characteristics of Big Data, often referred to as the three Vs, include:
- Volume: The amount of data generated.
- Velocity: The speed at which data is generated and processed.
- Variety: The different types of data (text, images, videos).
To dive deeper, utilize the following resources:
Practical exercises to enhance your understanding:
- Analyze a dataset using basic statistical methods.
- Identify the three Vs in a given dataset.
Hadoop And Spark
Hadoop and Spark are two of the most important big data technologies. Learning these will take around four weeks.
Hadoop is an open-source framework that allows for the distributed processing of large datasets. Key components include:
- HDFS (Hadoop Distributed File System): For storing data.
- MapReduce: For processing data.
Spark is a fast and general engine for large-scale data processing. It offers:
- Speed: Up to 100 times faster than Hadoop MapReduce.
- Ease of Use: APIs in Java, Scala, Python, and R.
- Advanced Analytics: Supports SQL queries, streaming data, machine learning, and graph processing.
Resources to master Hadoop and Spark:
Hands-on activities:
- Set up a Hadoop cluster on your local machine.
- Write a MapReduce program.
- Use Spark for a data processing task.
Data Streaming And Processing
Data streaming and processing is vital for real-time analytics. Mastering this will take around two weeks.
Data streaming involves processing data in real-time as it is generated. Key technologies include:
- Apache Kafka: A distributed streaming platform.
- Apache Flink: A stream processing framework.
Data processing can be batch or real-time. Batch processing handles large volumes of data at once, while real-time processing deals with continuous data streams.
Resources to get started:
Practical tasks:
- Set up a Kafka cluster and produce/consume messages.
- Use Apache Flink for a real-time data processing task.
Developing Domain Expertise
Embarking on a six-month journey to become a data scientist is ambitious but achievable with a structured roadmap. One crucial aspect of this journey is developing domain expertise. This expertise helps you understand the specific data needs and challenges within different industries. It also enables you to apply data science skills effectively to real-world problems.
Industry-specific Applications
Understanding industry-specific applications is essential for a data scientist. Each industry has unique data challenges and requirements. Here are a few examples:
- Healthcare: Analyzing patient data to improve treatment outcomes and predict disease outbreaks.
- Finance: Developing models to detect fraudulent activities and manage risk.
- Retail: Optimizing supply chain management and personalizing customer experiences.
To master industry-specific applications, allocate 2 weeks to study the following resources:
| Resource | Industry | Time |
|---|---|---|
| Coursera’s “AI for Medicine” | Healthcare | 2 weeks |
| edX’s “Data Science for Finance” | Finance | 2 weeks |
| Udacity’s “Predictive Analytics for Business” | Retail | 2 weeks |
Case Studies And Projects
Case studies and projects are crucial for applying theoretical knowledge. They provide practical experience and showcase your skills. Focus on the following:
- Healthcare Case Study: Analyze patient readmission rates. Use datasets like the Kaggle Hospital Readmissions dataset.
- Finance Project: Create a model to predict stock prices. Utilize data from Yahoo Finance.
- Retail Analysis: Implement a recommendation system. Use the MovieLens dataset for practice.
Dedicate 4 weeks to completing these projects. Divide your time as follows:
- 1 week for healthcare
- 1 week for finance
- 1 week for retail
- 1 week for refining and documenting your projects
Collaboration And Networking
Collaboration and networking are key for professional growth. Engaging with other data scientists can provide new insights and opportunities. Here are some ways to collaborate and network:
- Join Online Communities: Participate in forums like Reddit Data Science and Kaggle Discussions.
- Attend Meetups: Use Meetup.com to find local data science events.
- Collaborate on Projects: Contribute to open-source projects on GitHub.
Spend 2 weeks actively networking and collaborating:
- 1 week engaging in online communities
- 1 week attending meetups and collaborating on projects
Networking helps you stay updated with the latest trends and practices in data science. It also opens doors to job opportunities and collaborations.
Resources And Time Management
Embarking on the journey to become a data scientist in just 6 months requires a well-structured roadmap and efficient time management. Resources and time management are crucial to ensure you stay on track and make the most of your learning period. This section will guide you through the essential resources and how to manage your time effectively to achieve your goal.
Online Courses And Tutorials
Online courses and tutorials are essential for a structured learning path. They offer flexibility, allowing you to learn at your own pace. Coursera, edX, and Udacity are popular platforms offering comprehensive data science courses.
Here’s a suggested timeline for your online courses:
| Month | Course | Platform |
|---|---|---|
| 1 | Introduction to Data Science | Coursera |
| 2 | Python for Data Science | edX |
| 3 | Statistics and Probability | Udacity |
| 4 | Machine Learning | Coursera |
| 5 | Data Visualization | edX |
| 6 | Capstone Project | Udacity |
Weekly Schedule:
- Weekdays: 2 hours per day
- Weekends: 4 hours per day
Books And Publications
Books and publications provide in-depth knowledge and are great for reinforcing concepts learned online. Some recommended books include “Python Data Science Handbook” by Jake VanderPlas and “Data Science for Business” by Foster Provost and Tom Fawcett.
Here’s a reading plan:
| Month | Book |
|---|---|
| 1 | Python Data Science Handbook |
| 2 | Data Science for Business |
| 3 | Hands-On Machine Learning with Scikit-Learn and TensorFlow |
| 4 | Deep Learning with Python |
| 5 | Storytelling with Data |
| 6 | Doing Data Science |
Daily Reading Schedule:
- Weekdays: 1 hour per day
- Weekends: 2 hours per day
Data Science Communities And Forums
Joining data science communities and forums helps you stay updated and get support. Kaggle, Reddit’s r/datascience, and Stack Overflow are excellent platforms for connecting with other data scientists.
Engagement Plan:
- Kaggle: Participate in competitions and discussions.
- Reddit’s r/datascience: Engage in weekly threads and ask questions.
- Stack Overflow: Help others by answering questions.
Weekly Engagement Time:
- Weekdays: 30 minutes per day
- Weekends: 1 hour per day
Benefits:
- Networking with professionals
- Getting feedback on your projects
- Staying updated with industry trends
Frequently Asked Questions
How To Be A Data Scientist In 6 Months?
To become a data scientist in 6 months, focus on learning Python, statistics, machine learning, and data visualization. Complete online courses, work on real-world projects, and join data science communities. Consistent practice and dedication are essential.
What Is The Roadmap For A Data Scientist?
A data scientist’s roadmap includes mastering statistics, programming (Python, R), data visualization, machine learning, and big data tools. Gain practical experience through projects and internships. Enhance skills with online courses and certifications. Network with professionals and stay updated with industry trends.
What Are The 6 Stages Of Data Science Project?
The 6 stages of a data science project are: data collection, data cleaning, data exploration, feature engineering, model building, and model deployment.
What Is The Pathway For Data Scientist?
A data scientist’s pathway involves earning a relevant degree, mastering programming, learning statistics, gaining experience, and building a portfolio.
Conclusion
Embarking on the journey to become a data scientist in six months is challenging yet achievable. Follow this detailed roadmap, utilize the suggested resources, and stay committed to your learning schedule. With dedication and the right tools, you’ll be well-equipped to enter the dynamic field of data science.


