Find the perfect EDA tool for your data science projects. We compare features, pricing, and user experiences of top EDA software. Make an informed decision and streamline your data analysis workflow!
Data scientists rely heavily on Eda tools to efficiently analyze and visualize data sets. The choice of tool can significantly impact the workflow and outcomes of data analysis projects. In this blog post, we will explore the comparison of popular Eda tools used by data scientists, highlighting key features and considerations to help you make an informed decision.
By understanding the strengths and limitations of each tool, you can optimize your data analysis process and enhance the quality of insights derived from your data.

Credit: www.simplilearn.com
Pandas
Pandas is a popular library in Python for data analysis and manipulation. It provides flexible data structures and functions designed to work with structured data seamlessly. Data scientists rely heavily on Pandas for its ease of use and functionality.
Overview
Pandas is an open-source data analysis and manipulation library. It offers data structures like DataFrame and Series which handle different types of data. It is built on top of NumPy and integrates well with other libraries.
Key Features
- DataFrame: Two-dimensional, size-mutable, and potentially heterogeneous tabular data structure.
- Series: One-dimensional labeled array capable of holding any data type.
- Data Cleaning: Handle missing data, filter, and drop duplicates.
- Data Transformation: Merge, join, and concatenate datasets.
- Statistical Functions: Easily perform statistical analysis.
- Input/Output Tools: Read and write data from various formats like CSV, Excel, SQL, and JSON.
Pros And Cons
| Pros | Cons |
|---|---|
| Easy to learn and use | Memory usage can be high |
| Extensive documentation | Speed limitations with large datasets |
| Flexible data handling | Requires understanding of Python programming |
| Excellent community support | Some operations can be slow |
| Integrates well with other libraries | Limited support for multi-threading |
Credit: learn.microsoft.com
Matplotlib
Matplotlib is a popular data visualization library for Python. It is widely used by data scientists for creating static, interactive, and animated plots.
Overview
Matplotlib is an essential tool for data scientists. It helps in plotting various graphs and charts easily. It is highly customizable and can generate a variety of plots.
Key Features
- Versatile Plotting: Supports line, bar, scatter, and pie charts.
- Customization: Offers extensive customization options for plots.
- Integration: Works well with other Python libraries like NumPy and Pandas.
- Interactive Plots: Can create interactive plots using backends like Tkinter.
- Export Options: Can save plots in various formats like PNG, PDF, SVG, and more.
Pros And Cons
| Pros | Cons |
|---|---|
|
|
Seaborn
Data scientists often use various tools for Exploratory Data Analysis (EDA). One popular tool is Seaborn. Seaborn is a Python library that builds on top of Matplotlib. It provides a high-level interface for drawing attractive and informative statistical graphics.
Overview
Seaborn simplifies the process of creating complex visualizations. It integrates well with Pandas data structures. This makes it easy to create plots directly from data frames. Seaborn helps data scientists visualize distributions, relationships, and trends in their data.
Key Features
- High-Level Interface: Offers a simpler interface for complex plots.
- Statistical Plots: Facilitates the creation of statistical graphics.
- Color Palettes: Provides a variety of color palettes for better visuals.
- Integration: Works seamlessly with Pandas and NumPy.
- Plot Aesthetics: Enhances the aesthetics of default Matplotlib plots.
Pros And Cons
| Pros | Cons |
|---|---|
| Easy to use for beginners. | Limited customization options. |
| Beautiful default styles. | Slower performance with large datasets. |
| Works well with Pandas. | Requires understanding of Matplotlib for advanced customization. |
| Comprehensive documentation. | Fewer plot types compared to Matplotlib. |
Plotly
Plotly is a popular tool among data scientists for data visualization and exploratory data analysis (EDA). It offers an array of interactive plotting options, making it easy to uncover insights from complex datasets.
Overview
Plotly is a versatile library designed for interactive and high-quality visualizations. It supports various chart types, including line plots, bar charts, scatter plots, and more. Plotly is widely used in Python, R, and JavaScript environments.
Key Features
- Interactivity: Create interactive plots with zoom, pan, and hover features.
- Wide Range of Charts: Supports numerous chart types like line, bar, scatter, and 3D plots.
- Ease of Use: Simple syntax and comprehensive documentation make it user-friendly.
- Integration: Works seamlessly with popular data science tools like Pandas and NumPy.
- Customization: Allows extensive customization of plots for better visualization.
Pros And Cons
| Pros | Cons |
|---|---|
| Highly interactive plots | Can be slow with very large datasets |
| Great for creating dashboards | Requires internet connection for some features |
| Supports 3D plotting | Learning curve for advanced customization |
| Easy integration with Python and R | Limited offline capabilities |
Overall, Plotly is a powerful tool for data scientists. Its interactive features and wide range of chart options make it a valuable asset for EDA.
Tableau
Tableau is a powerful tool for data visualization and analysis. It helps data scientists transform data into actionable insights. With an intuitive interface, it makes complex data simple to understand. This section explores Tableau’s features and evaluates its pros and cons.
Overview
Tableau is a leading platform for data visualization and business intelligence. It allows users to create interactive and shareable dashboards. These dashboards can be accessed on the go via mobile or web.
Tableau connects to various data sources. It integrates with spreadsheets, databases, big data, and cloud services. It is designed to handle large volumes of data, offering robust performance.
Key Features
- Interactive Dashboards: Create dynamic and interactive visualizations.
- Data Blending: Combine data from different sources for a comprehensive view.
- Real-time Analysis: Get instant insights with real-time data updates.
- Drag-and-Drop Interface: Easily build visualizations without coding.
- Extensive Connectivity: Connect to multiple data sources seamlessly.
- Collaboration Tools: Share insights and collaborate with teams.
Pros And Cons
| Pros | Cons |
|---|---|
|
|
Power Bi
Power BI is a powerful data visualization tool. It helps data scientists analyze data effectively. This tool is developed by Microsoft. Power BI provides interactive visualizations and business intelligence capabilities. It offers an easy-to-use interface for creating reports and dashboards.
Overview
Power BI is a suite of business analytics tools. It allows users to connect to various data sources. Users can transform and visualize data in real-time. Power BI integrates with many Microsoft services. It is available in both cloud-based and desktop versions.
Key Features
- Interactive Dashboards: Create interactive and shareable dashboards.
- Data Connectivity: Connect to a wide range of data sources.
- Custom Visuals: Use a variety of custom visuals.
- Natural Language Queries: Ask questions and get answers using natural language.
- Mobile Accessibility: Access reports and dashboards on mobile devices.
Pros And Cons
| Pros | Cons |
|---|---|
|
|
Comparison And Ranking
Explore the world of Eda tools for data scientists through detailed comparison and ranking. Gain insights into the best tools for streamlined data analysis and visualization in a competitive market. Make informed decisions based on comprehensive evaluations of features and functionalities.
Feature Comparison
Performance Analysis
Ease Of Use
Final Rankings
In the Comparison and Ranking section, we will delve into the key aspects of Eda Tools. Feature Comparison examines the functionalities offered. Performance Analysis assesses speed and efficiency. Ease of Use focuses on user-friendliness. Final Rankings will showcase the best tools based on these factors. Let’s dive into the details.
Feature Comparison
Performance Analysis
– Tool A excels in processing large datasets efficiently.
– Tool B offers real-time analysis capabilities.
– Tool C provides quick response times for complex queries.
Ease Of Use
– Tool A has a user-friendly interface.
– Tool B offers intuitive navigation.
– Tool C provides customizable dashboards for easy data interpretation.
Final Rankings
1. Tool A: Top choice for advanced statistical functions and performance.
2. Tool C: Great for dynamic visualization and ease of use.
3. Tool B: Ideal for real-time analysis and interactive features.

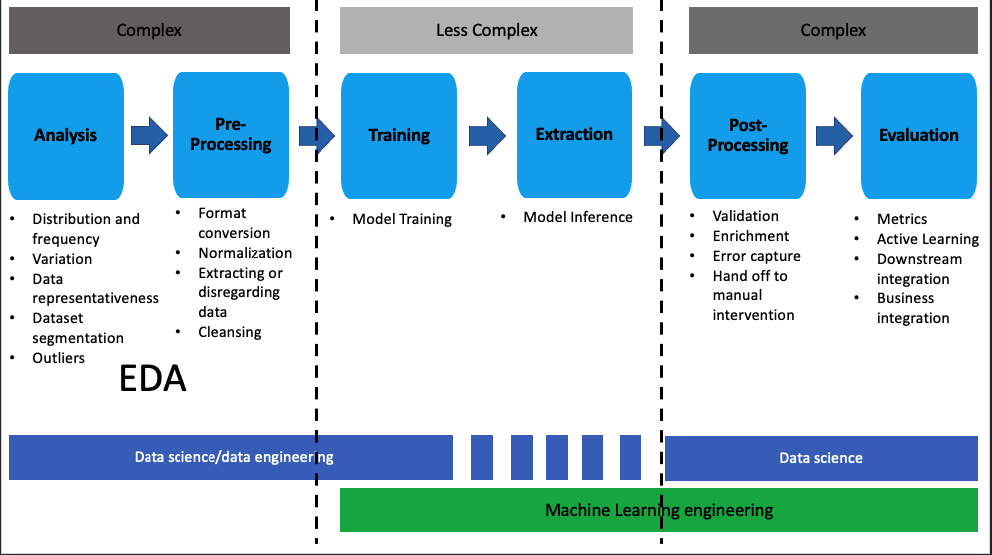
Credit: www.researchgate.net
Frequently Asked Questions
What Are The Tools Used In Eda In Data Science?
Common tools for EDA in data science include Python libraries like pandas, NumPy, Matplotlib, and Seaborn. R packages like ggplot2 and dplyr are also popular.
What Are The Four Types Of Eda?
The four types of Exploratory Data Analysis (EDA) are univariate, bivariate, multivariate, and graphical. Univariate EDA examines a single variable. Bivariate EDA explores relationships between two variables. Multivariate EDA analyzes more than two variables. Graphical EDA uses visual tools like histograms and scatter plots.
What Is The Best Automated Eda?
The best automated EDA tool is Tableau. It offers intuitive data visualization, robust analytics, and easy integration with various data sources.
What Are The Classification Of Eda Tools?
EDA tools are classified into simulation, synthesis, verification, and physical design tools. Each serves a specific design stage.
Conclusion
Choosing the right EDA tool is crucial for data scientists. Each tool offers unique features and benefits. Consider your specific needs and project requirements. By understanding the strengths of each tool, you can make an informed decision. Stay updated with the latest advancements to maximize your data analysis efficiency.

