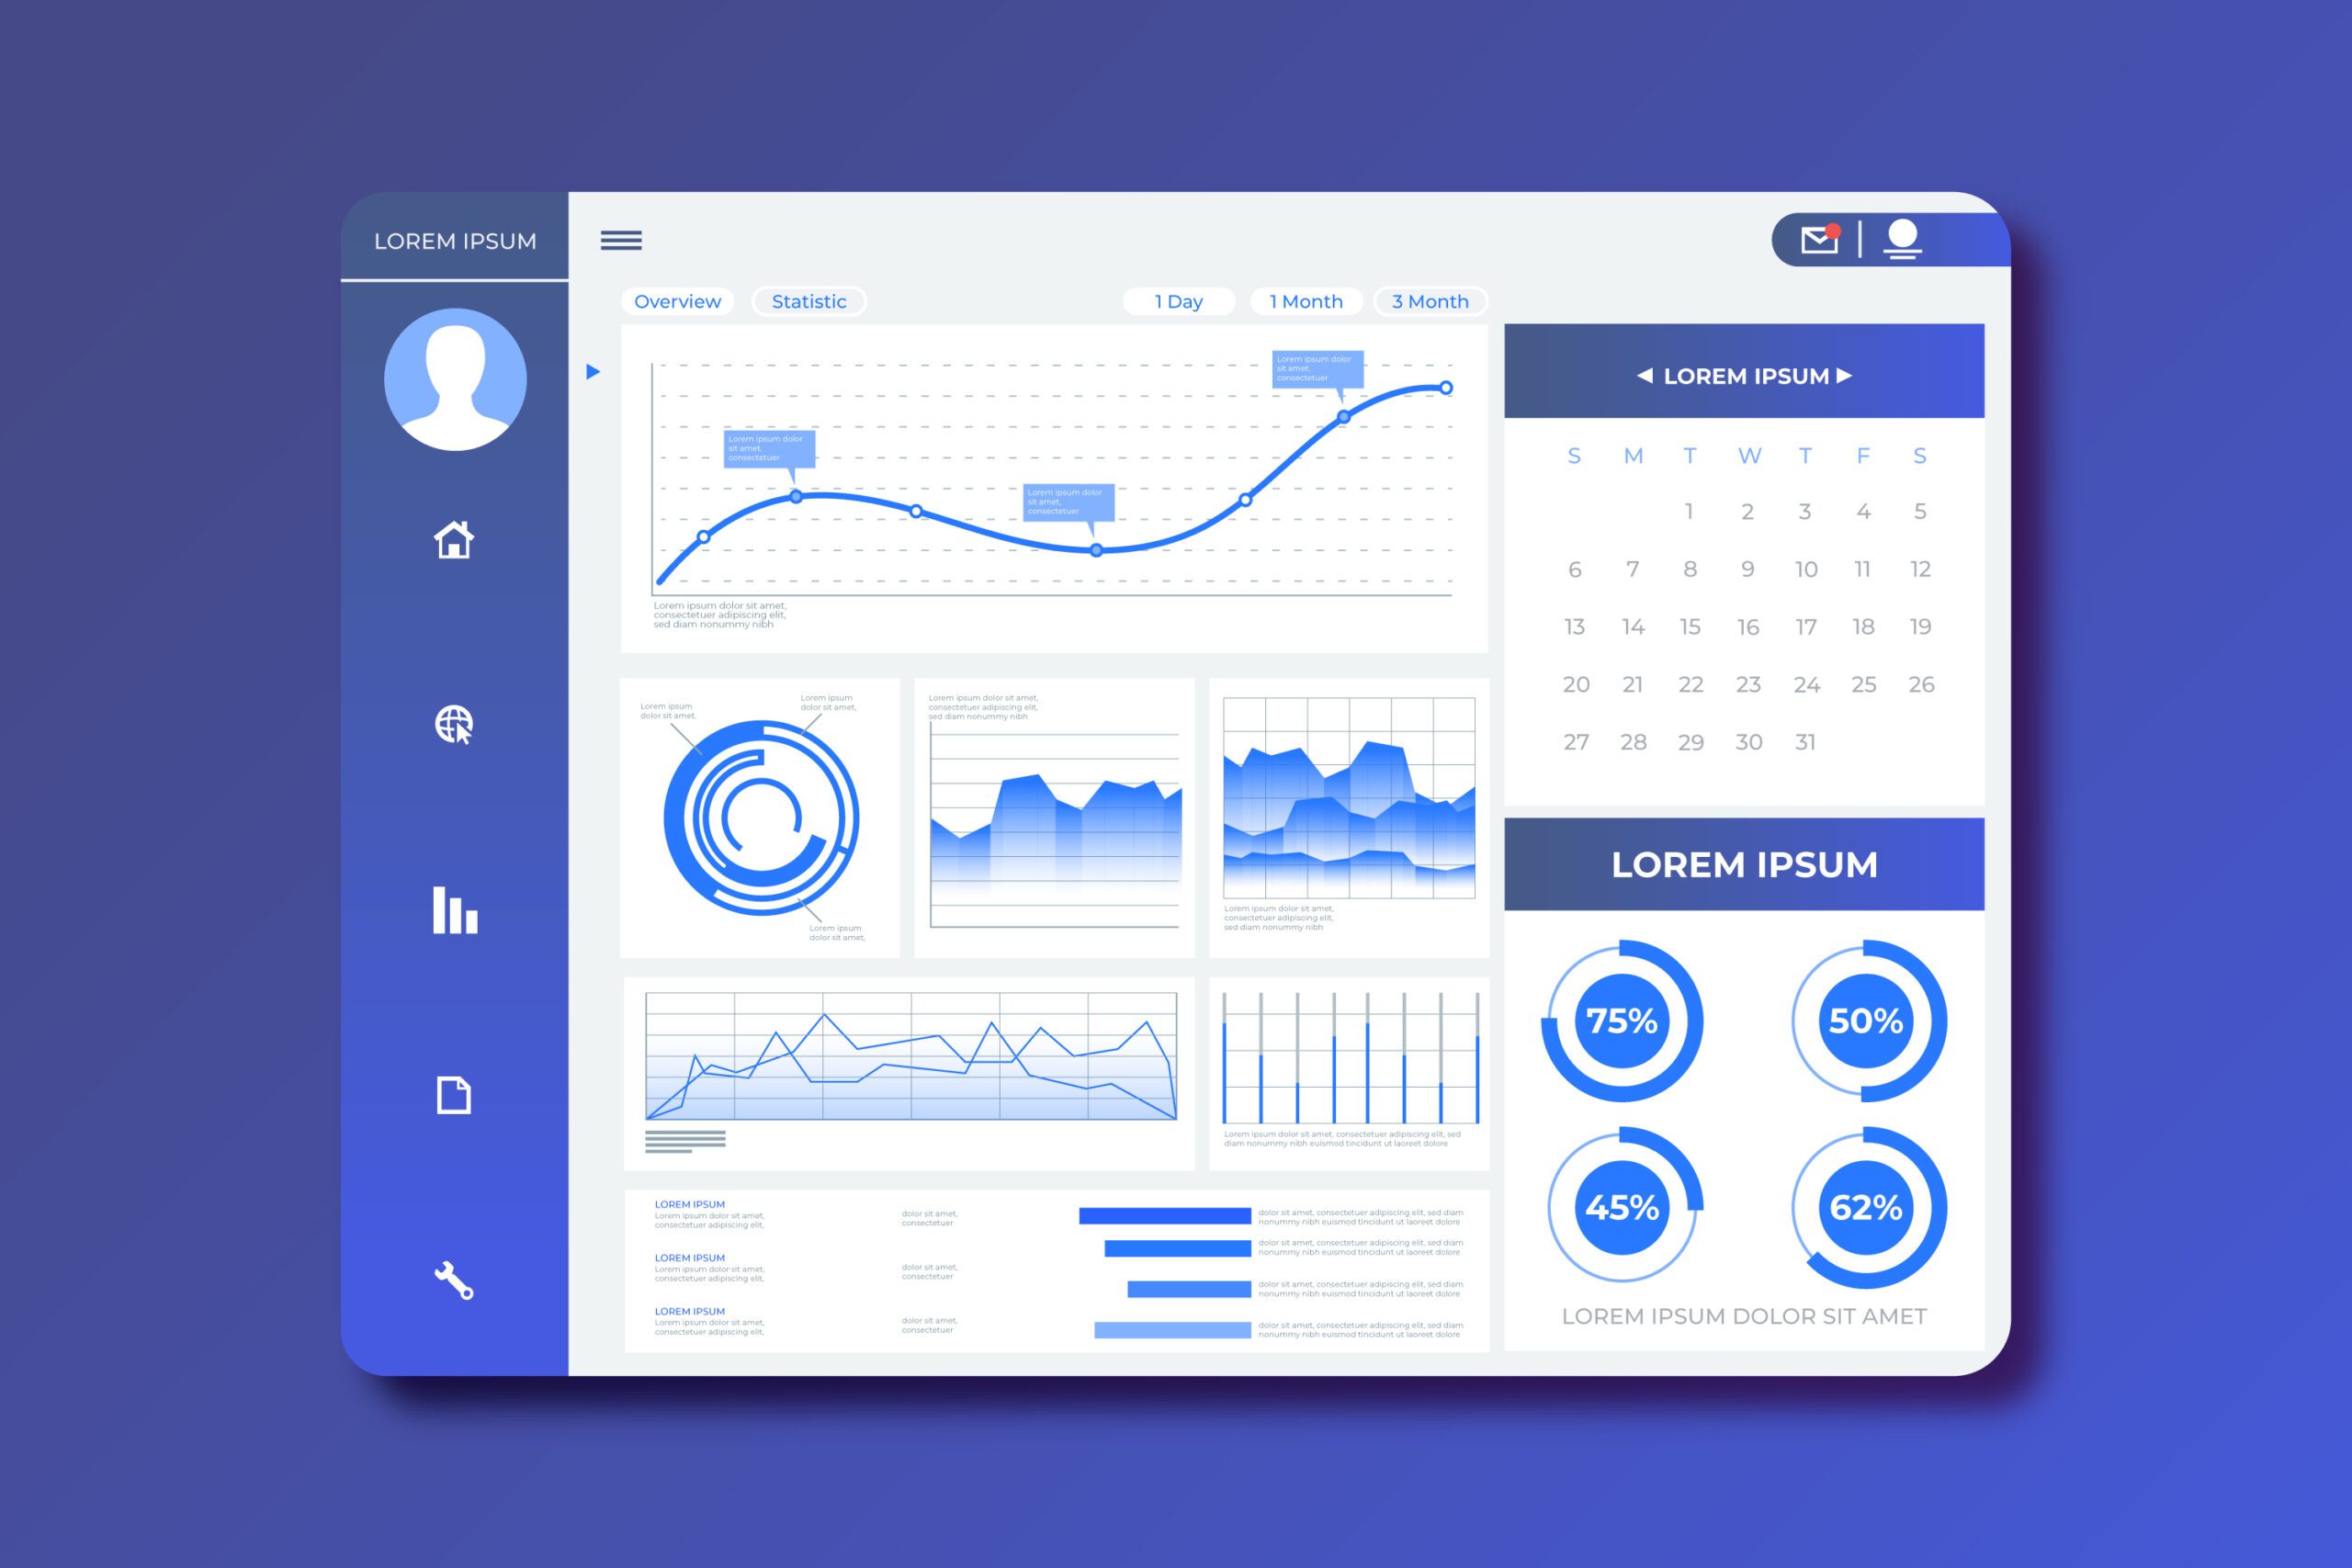
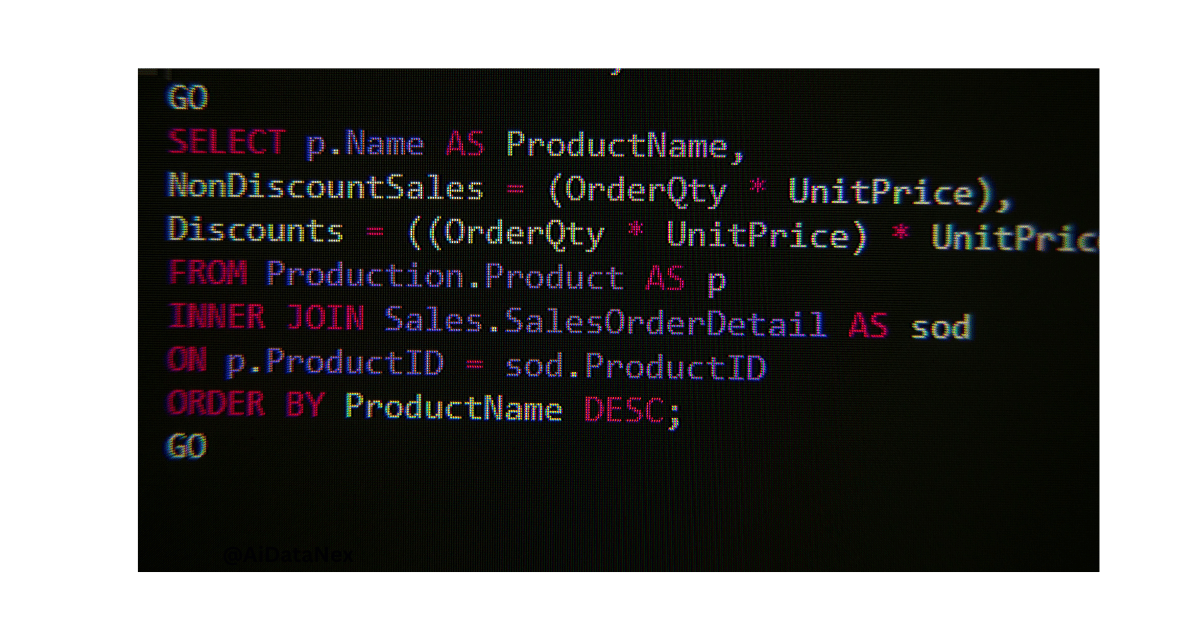
Transform raw data into compelling visual stories using SQL. Learn to create interactive dashboards, charts, and graphs. Communicate insights effectively. Click to enhance your data visualization skills!
Interactive dashboards are crucial for businesses to monitor, analyze, and present data insights in real-time. SQL, or Structured Query Language, is the backbone for querying and managing data stored in databases. With SQL, you can extract, filter, and transform data to meet specific criteria.
Integrating SQL with visualization tools like Tableau, Power BI, or custom web applications enhances the interactivity and user experience. These dashboards enable users to drill down into details, identify trends, and make informed decisions quickly. By leveraging SQL, you ensure data accuracy and relevance, making your dashboards a reliable resource for strategic planning.
Introduction To Interactive Dashboards
Dashboards help users see data in one place. This makes it easy to understand. They save time by showing key information quickly. Important metrics are visible at a glance. This helps in making quick decisions. Dashboards also track performance over time. They help in spotting trends and patterns.
Interactive dashboards let users drill down into data. This makes it easier to find details. Users can filter data based on their needs. This customization helps in getting specific answers. Interactive elements keep users engaged. They make the dashboard more user-friendly. Users can also update the dashboard with new data. This keeps the information current and relevant.
Basics Of Sql For Dashboards
Creating interactive dashboards using SQL involves querying databases to extract relevant data. SQL enables dynamic data visualization for real-time insights. Mastering SQL fundamentals enhances the ability to build robust, interactive dashboards.
Sql Queries Overview
SQL is the language used to talk to databases. It stands for Structured Query Language. You can use it to get data from a database. This is called a query. You can also use SQL to change the data. This is called an update. SQL is very powerful and can do a lot.
Types Of Sql Commands
| Command Type | Function |
|---|---|
| SELECT | Gets data from the database. |
| INSERT | Adds new data to the database. |
| UPDATE | Changes data in the database. |
| DELETE | Removes data from the database. |
Setting Up Your Environment
Set up your development environment to create interactive dashboards using SQL seamlessly. Optimize your tools and configurations for efficient data visualization.
Required Tools And Software
You need a few tools to start. SQL Server is essential. A data visualization tool like Tableau or Power BI is also needed. A text editor such as VS Code helps in writing SQL queries. Lastly, make sure to have sample data for practice.
Installation And Configuration
First, install SQL Server on your computer. Follow the setup instructions carefully. Next, download and install Tableau or Power BI. Configure these tools to connect with SQL Server. Open your text editor and write your first SQL query. Run the query to ensure everything works fine. Now, you are ready to create interactive dashboards.
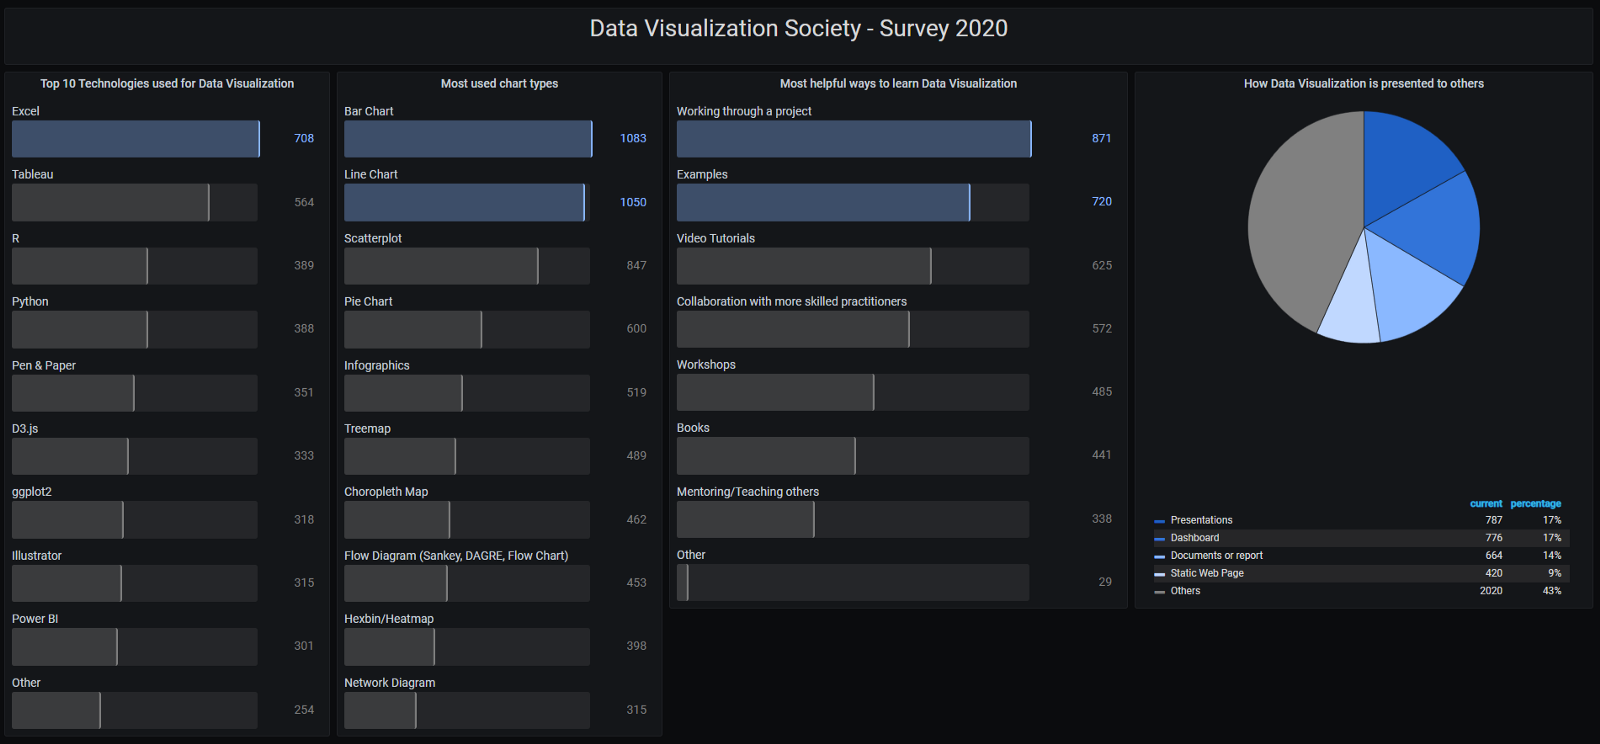
Credit: nightingaledvs.com
Designing Your Dashboard
Start by finding the most important numbers. These are your key metrics. They show how well things are going. Sales numbers, customer counts, and website visits are good examples. Write them down. Make sure they are easy to understand. These metrics should be clear and helpful.
Pick the best charts for your data. Bar charts and line charts work well for most data. Pie charts show parts of a whole. Use tables for detailed information. Make sure your charts are easy to read. Use colors to make data stand out. The right visualizations make your dashboard clear and useful.
Writing Sql Queries For Data Retrieval
Crafting SQL queries for data retrieval powers interactive dashboards, turning raw data into actionable insights. Elevate your analytics by mastering SQL for real-time data visualization.
Selecting Data Sources
Selecting the right data sources is crucial. It ensures accurate and relevant data. Use multiple data sources if needed. Join tables to combine information. Use `JOIN` statements in SQL. Ensure data integrity by checking relationships. Verify data quality before using it. Use primary keys to link tables.
Optimizing Query Performance
Optimizing queries improves dashboard performance. Use indexes on columns. Avoid using `SELECT ` in queries. Select only needed columns. Use query execution plans to identify slow queries. Optimize `JOIN` conditions for better performance. Use subqueries wisely to avoid slowdowns.

Credit: www.reddit.com
Building Interactive Elements
Filters help users see specific data. They make dashboards more useful. Add dropdowns for quick filtering. Use sliders to adjust date ranges. Buttons can switch views. These controls enhance user experience.
Drill-down features let users explore data in detail. Clicking on a chart can show more data. This keeps dashboards clean. Users can see summaries at first. Detailed data is just a click away. This makes dashboards powerful and flexible.
Integrating Sql With Dashboard Tools
First, gather your data sources. Use SQL to pull data from databases. Connect your dashboard tool to the database. Make sure to use secure connections. This keeps your data safe. Verify the connection is stable. This avoids disruptions in your dashboard.
Write SQL queries to fetch data. Embed these queries in your dashboard tool. Make sure the queries are efficient. This speeds up data loading. Use filters and parameters in your queries. This makes your dashboard interactive. Always test your queries. Ensure they return the correct data.
Testing And Deployment
Testing and deployment ensure your interactive SQL dashboards function flawlessly. Streamline data visualization and enhance user experience through meticulous testing. Deploy securely for reliable performance.
Ensuring Data Accuracy
Data accuracy is crucial for dashboards. Start by validating data sources. Ensure all data points match expected values. Use SQL queries to cross-check data. Regular checks help maintain accuracy. Detect errors early to avoid issues later. Clean data before using it in the dashboard. Accurate data boosts user trust. Use automated scripts for consistent checks. Consistent data leads to better decisions. Implement alerts for data discrepancies. This ensures immediate action when needed.
Deploying To Production
Deploying dashboards requires a structured approach. Start with a staging environment. Test all functionalities thoroughly. Ensure the dashboard performs well under load. Optimize SQL queries for speed. Users expect fast and reliable dashboards. Backup all data before deployment. This protects against data loss. Monitor the dashboard post-deployment. Address any issues promptly. Regular updates keep the dashboard relevant. User feedback is crucial for improvements. Encourage users to report any issues. Continuous improvement ensures long-term success.
Best Practices And Tips
Use optimized SQL queries to improve performance. Ensure data is indexed properly. This helps with faster data retrieval. Limit the amount of data displayed at once. Use pagination to handle large datasets. Cache frequently accessed data to reduce load times.
Regularly monitor dashboard performance. Identify and fix slow queries. Use database profiling tools to find performance bottlenecks. Keep your database schema clean and well-organized. Avoid using complex joins and subqueries whenever possible.
Make your dashboard easy to navigate. Use clear labels and intuitive icons. Ensure all buttons are easy to find. Organize data into logical sections. This helps users find information quickly.
Use consistent colors and fonts. This makes the dashboard look professional. Ensure the text is readable. Avoid using too many colors. Stick to a simple color scheme. This prevents the dashboard from looking cluttered.
Credit: github.com
Future Trends In Interactive Dashboards
Artificial Intelligence helps make dashboards smarter. AI predicts trends and suggests actions. Machine Learning learns from data. It helps to automate tasks. Real-time data streaming offers live updates. Live updates help in making quick decisions. Augmented Reality adds a new layer to dashboards. AR makes data visualization more interactive.
Voice Interfaces are becoming popular. Users can talk to their dashboards. This makes it easier to get data. Predictive analytics shows future trends. It helps in planning ahead. Blockchain ensures data security. It keeps data tamper-proof. IoT Integration brings data from devices. This enriches the dashboard with more data.
Dashboards will become even more user-friendly. Customization will be key. Users will get more control over their data views. Collaboration features will improve. Teams will work together more easily. More mobile-friendly dashboards will be developed. This allows access on the go.
Data storytelling will gain importance. Dashboards will tell stories with data. Visuals will become more engaging. Focus on security will increase. Users will trust dashboards more. Integration with other tools will grow. This makes dashboards more powerful. Automation will handle repetitive tasks. This frees up time for creative work.
Frequently Asked Questions
Can Sql Create Visualizations?
SQL itself cannot create visualizations. Use SQL to retrieve data and tools like Tableau or Power BI to visualize it.
How To Create A Dashboard Using Mysql?
Create a dashboard using MySQL by connecting a visualization tool like Tableau. Use SQL queries to fetch data. Configure charts, graphs, and tables to display insights. Ensure the dashboard updates in real-time with dynamic queries. Secure your database connection for safety.
How To Make A Database Dashboard?
To make a database dashboard, choose a suitable tool, connect your database, and select relevant data visualizations. Customize the layout, apply filters, and ensure real-time updates. Save and share the dashboard with stakeholders.
How To Use Sql Performance Dashboard?
Access the SQL Performance Dashboard via SQL Server Management Studio. Navigate to “Performance Dashboard” under “Management” and analyze key performance metrics. Use the dashboard to identify and resolve performance bottlenecks.
Conclusion
Creating interactive dashboards using SQL enhances data analysis and decision-making. By mastering SQL, you unlock powerful insights. Start with basic queries and progressively tackle complex datasets. Practice regularly to refine your skills. Embrace the power of interactive dashboards to transform raw data into actionable intelligence, driving better business outcomes.

