Unsupervised machine learning identifies hidden patterns in data without using labeled responses. It is crucial for data clustering and dimensionality reduction.
Unsupervised machine learning is a key technique in data science. It helps discover underlying patterns and structures in datasets. This method operates without predefined labels, making it ideal for exploratory data analysis. Clustering and dimensionality reduction are two main applications.
Clustering groups similar data points, enhancing data organization and insights. Dimensionality reduction simplifies data, reducing noise and computational load. These techniques are invaluable in fields like bioinformatics, customer segmentation, and anomaly detection. By leveraging unsupervised machine learning, data scientists can extract meaningful information, drive innovation, and make informed decisions.

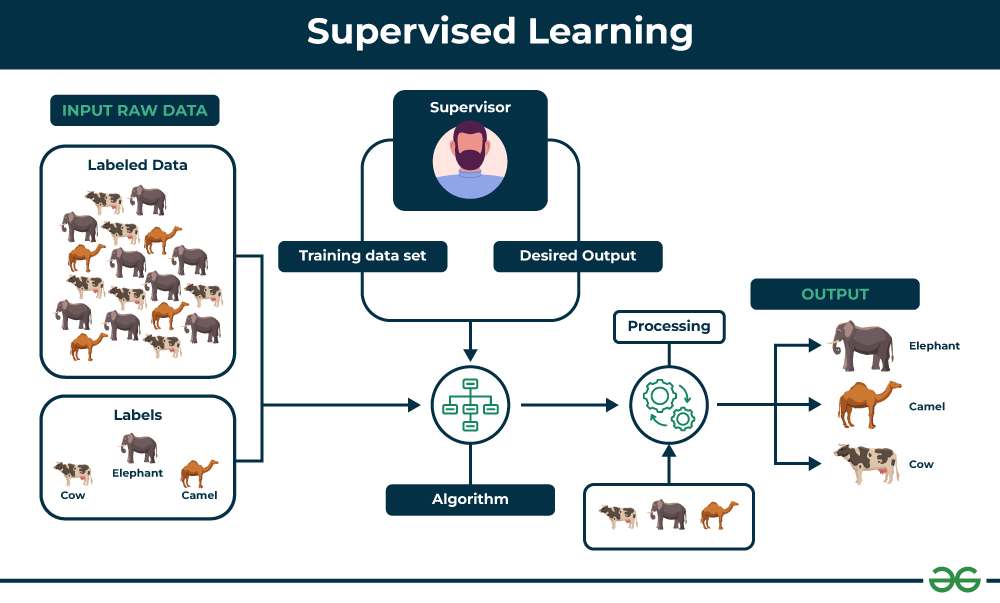
Credit: www.geeksforgeeks.org
Introduction To Unsupervised Learning
Unsupervised learning involves training a model without labeled data. The model identifies patterns and structures in the data. Data is categorized into clusters or groups. This process is called clustering. Clustering helps in identifying similarities in data. Another method is Dimensionality Reduction. This reduces the number of features in the data. It helps in simplifying the data while retaining its essence.
Unsupervised learning has many applications in data science. One common use is customer segmentation. Companies group customers based on buying behavior. Another use is in anomaly detection. It identifies unusual patterns in data. This is useful in fraud detection. Recommendation systems also use unsupervised learning. They suggest products based on user preferences. Image recognition is another application. It groups similar images together.

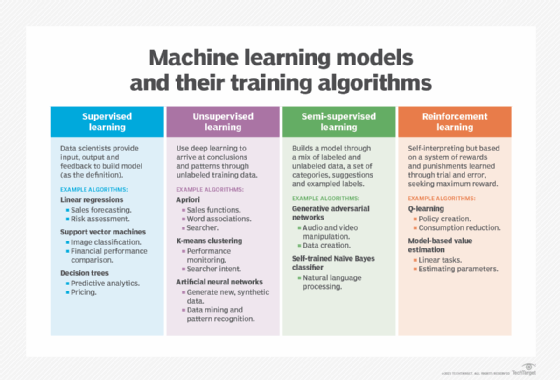
Credit: www.techtarget.com
Key Algorithms In Unsupervised Learning
K-Means is a popular algorithm. It groups data into clusters. Each cluster has a center. The data points in a cluster are similar. The center of the cluster is called the centroid. K-Means is easy to use and fast. It works well with large datasets.
Hierarchical clustering builds a tree of clusters. It can be agglomerative or divisive. Agglomerative clustering starts with one point. Divisive clustering starts with one big cluster. Hierarchical clustering is easy to understand.
Principal Component Analysis (PCA) reduces the number of features. It keeps the important information. PCA makes data easier to visualize. It is useful for high-dimensional data.
t-Distributed Stochastic Neighbor Embedding (t-SNE) is a non-linear method. It helps in visualizing high-dimensional data. t-SNE reduces the data to two or three dimensions. It is useful for data exploration.
Data Preparation For Unsupervised Learning
Good data quality is vital for machine learning. High-quality data leads to better models. Accurate data helps algorithms learn correctly. Clean data prevents errors and inconsistencies. Consistent data ensures reliable results. Complete data avoids missing information. Timely data ensures relevance. Standardized data simplifies processing. Ensuring quality data saves time and effort. It also improves the overall performance of machine learning models.
Preprocessing improves data for unsupervised learning. Normalization scales data to a common range. Standardization adjusts data to have a mean of zero. Imputation fills in missing values. Encoding transforms categorical data into numerical form. Dimensionality reduction reduces features while retaining important information. Outlier detection identifies and removes anomalies. Data augmentation increases dataset size. Noise reduction filters out irrelevant data.

Credit: blog.roboflow.com
Clustering: Grouping Hidden Patterns
Cluster quality is very important. Good clusters have similar items together. Different clusters have different items. Use metrics like Silhouette Score to check this. High scores mean good clusters. Low scores mean bad clusters. Visual tools like Dendrograms help too. They show hierarchical relationships. Elbow Method is another tool. It helps find the best number of clusters.
Market segmentation uses clustering. It groups customers by behavior. Retailers use it to find shopper habits. Banks use it to spot spending patterns. Marketers create targeted ads. They reach specific groups. This makes ads more effective. Insurance companies use it too. They find risk groups. This helps in pricing policies. Healthcare uses it for patient data. It improves treatment plans.
Dimensionality Reduction Explained
Dimensionality reduction helps reduce the number of features in a dataset. This makes computations faster. Algorithms run quicker with fewer features. It also helps in removing noise from data. Clean data improves algorithm performance. Principal Component Analysis (PCA) is a popular method. PCA finds the main components of data. This reduces the overall number of dimensions.
Visualizing data with many dimensions is hard. Dimensionality reduction makes it easier. Two or three dimensions are simpler to see. t-SNE is a method used for this. It shows clusters and patterns clearly. This helps in understanding data better. Graphs and plots become easier to read. This makes insights more obvious.
Anomaly Detection And Its Significance
Outliers are unusual data points. They do not fit the pattern of other data. Finding outliers is important. They can show errors in data. They can also show rare events.
Unsupervised machine learning helps find outliers. It does this without labeled data. This makes it very useful. It saves time and effort.
Detecting fraud is a key use of anomaly detection. Fraudulent activities often look different from normal activities. Finding these differences can help stop fraud.
Unsupervised machine learning can spot these differences. It looks at patterns in data. It then finds what does not fit. This helps in catching fraud early.
Association Rules In Market Basket Analysis
Understanding consumer behavior is crucial for businesses. Patterns in purchase data reveal customer preferences. Market basket analysis helps find these patterns. It examines items bought together. This information helps improve sales strategies. For example, bread and butter often sell together. Knowing this, stores place them nearby. This increases the chance of both being purchased.
The Apriori algorithm finds frequent itemsets in data. It helps discover association rules. These rules show how items relate. For instance, if a customer buys milk, they may buy cookies too. The algorithm works in two steps. First, it finds frequent itemsets. Second, it generates rules from these itemsets. The support and confidence measures assess the rules. High support means the rule is common. High confidence means the rule is reliable. This helps businesses make smart decisions. They can tailor offers based on these insights.
Neural Networks And Deep Learning
Autoencoders help in feature learning by encoding and decoding data. They compress data into a smaller size, keeping only important features. This process helps in reducing noise and improving data quality. Feature learning becomes easier with autoencoders. They are useful in many applications like image processing and data denoising.
Self-Organizing Maps (SOMs) are used for data visualization. They help in understanding complex data by creating maps. These maps show data clusters and patterns. SOMs are useful for understanding high-dimensional data. They are great for tasks like market segmentation and customer profiling.
Evaluating And Tuning Models
Use Silhouette Score to measure cluster quality. It ranges from -1 to 1. A higher score means better clusters. Davies-Bouldin Index is another method. A lower index indicates better clusters. Use the Elbow Method to find the optimal number of clusters. Plot the cost function and look for an “elbow” point. The Calinski-Harabasz Index is also useful. A higher score means better defined clusters.
Use feature scaling to improve model performance. Scaling ensures all features contribute equally. Dimensionality reduction helps by reducing noise. Techniques like PCA can be used. Hyperparameter tuning is crucial. Adjust parameters to get the best results. Algorithm selection is also key. Different algorithms work better for different data. Cross-validation helps test the model’s stability. It ensures the model performs well on new data.
Real-world Examples Of Unsupervised Learning
Unsupervised learning can detect patterns in medical data. This helps in early diagnosis of diseases. For instance, it can find clusters of similar patient symptoms. This improves treatment plans and patient care. It also helps in identifying rare diseases. Hospitals use it to optimize resource allocation. This reduces costs and improves efficiency. Anomaly detection finds unusual patterns in medical images. This helps in early detection of tumors.
Autonomous vehicles use unsupervised learning to navigate. It helps in detecting obstacles and recognizing traffic patterns. The system can classify different objects on the road. It also predicts the movement of other vehicles. This ensures safe driving and reduces accidents. Data clustering helps in understanding traffic behavior. This improves route planning and fuel efficiency. Unsupervised learning also helps in predictive maintenance. This keeps vehicles in top condition.
Challenges And Future Directions
Complex data can be hard to understand. Data can be messy and confusing. Unsupervised learning helps to find patterns. It works without any labels. This makes it very useful. Cleaning data is the first step. It makes data easier to work with. Dimensionality reduction helps too. It reduces the number of variables. This makes data simpler. Clustering is another method. It groups similar data points. This helps to find hidden structures.
Combining supervised and unsupervised learning offers many benefits. Supervised learning uses labeled data. Unsupervised learning does not need labels. Together, they make a strong team. Semi-supervised learning uses both methods. It needs less labeled data. This saves time and effort. Transfer learning is another technique. It uses knowledge from one task for another. This improves model performance. Reinforcement learning can also be combined. It learns from actions and rewards. This creates powerful AI systems.
Frequently Asked Questions
What Is Unsupervised Machine Learning In Data Science?
Unsupervised machine learning analyzes data without labeled outcomes. It identifies patterns and structures in datasets autonomously. Common techniques include clustering and dimensionality reduction. These methods help discover hidden insights, relationships, and groupings within the data, aiding in data exploration and understanding.
What Are Examples Of Unsupervised Learning?
Examples of unsupervised learning include clustering, association, and dimensionality reduction. Techniques like K-means, Apriori, and PCA are commonly used.
Is Chatgpt Supervised Or Unsupervised?
ChatGPT is trained using a combination of supervised and unsupervised learning. Supervised learning involves labeled data, while unsupervised learning uses unlabeled data to find patterns.
When To Use Unsupervised Machine Learning?
Use unsupervised machine learning for clustering, anomaly detection, and pattern recognition in datasets without labeled responses. It helps in discovering hidden structures in data.
Conclusion
Unsupervised machine learning opens new doors for data science. It reveals hidden patterns without labeled data. This approach can enhance your analytical capabilities. Embracing these techniques will lead to innovative solutions. Stay ahead in data science by mastering unsupervised learning methods.
The future of data analysis lies in your hands.

