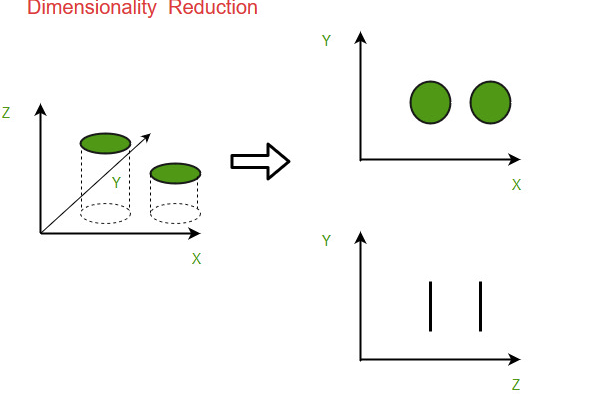
Dimensionality reduction is a process that reduces the number of random variables under consideration. It simplifies data while retaining essential information.
Dimensionality reduction techniques are crucial in data science and machine learning. They help manage and analyze large datasets effectively. High-dimensional data can be complex and computationally expensive. Methods like Principal Component Analysis (PCA) and t-Distributed Stochastic Neighbor Embedding (t-SNE) are popular choices.
These techniques improve model performance and reduce overfitting by eliminating irrelevant features. They also enhance visualization, making patterns in the data more apparent. By focusing on the most significant variables, dimensionality reduction streamlines the data analysis process. This results in more efficient and accurate predictive models.
The Essence Of Dimensionality Reduction
Big data can be hard to handle. Too many features make it complex. It becomes slow to process. Memory usage increases. Storage space is also a concern. Simplifying data can help a lot. Removing less important features is key.
High-dimensional data can be tricky. More dimensions mean more calculations. Patterns are harder to find. Models may not work well. Accuracy drops with more features. Training time also increases. Dimensionality reduction makes it easier. It helps find true patterns.
Principal Component Analysis (pca)
PCA helps in reducing dimensions of data. It transforms data into a new set of variables. These new variables are called principal components. Each component captures maximum variance. This means that the first principal component has the highest variance. The second principal component has the second highest, and so on. PCA makes data easier to visualize. It also helps in speeding up machine learning models.
Imagine a dataset with 100 features. This can be hard to analyze. PCA can reduce these features to a smaller number. For example, PCA might reduce 100 features to 3 principal components. These 3 components will still capture most of the data’s information. This makes analysis much simpler. Models trained on these components can perform better and faster.
T-distributed Stochastic Neighbor Embedding (t-sne)
t-SNE stands for t-Distributed Stochastic Neighbor Embedding. It is a technique for dimensionality reduction. t-SNE helps to visualize high-dimensional data. It reduces the dimensions while keeping the data structure. It is useful for data with many features. t-SNE is based on probability distributions. It finds similarities between data points. Then, it maps these points in a lower-dimensional space.
High-dimensional data is hard to visualize. t-SNE makes it easier to see patterns. It creates a 2D or 3D map of the data. Each point on the map represents a data point. Close points are similar, and far points are different. This helps to find clusters and outliers. t-SNE is popular in machine learning and data science.
Linear Discriminant Analysis (lda)
LDA is used for feature extraction in data. It helps in reducing the number of features. LDA works by finding the best linear combinations of features. These combinations separate different classes. This is useful in classification problems. It makes the data easier to understand. LDA focuses on maximizing the separation between classes. This makes the features more discriminative. The main goal is to reduce dimensions while retaining class information.
LDA and PCA are both dimensionality reduction techniques. LDA focuses on class separation. PCA focuses on maximizing variance. LDA is useful for supervised learning. PCA is useful for unsupervised learning. LDA requires class labels. PCA does not need class labels. LDA works well with smaller datasets. PCA works with any dataset size. LDA aims to find the feature space that best discriminates classes. PCA aims to find the directions that maximize the variance.
Autoencoders: A Neural Network Approach
Autoencoders are a type of neural network. They are used to learn efficient codings of data. They consist of two main parts: an encoder and a decoder. The encoder maps the input to a latent space representation. The decoder maps the latent space back to the input space. The goal is to make the output as close to the input as possible. This process helps in reducing dimensions.
Autoencoders help to reduce the number of features. They can handle non-linear data well. Traditional methods like PCA may struggle with such data. Autoencoders can learn complex patterns. This makes them effective for dimensionality reduction. They are also useful for denoising data. This means they can remove noise while keeping important features.

Credit: www.researchgate.net
Uniform Manifold Approximation And Projection (umap)
UMAP is fast and efficient. It works well with large datasets. UMAP keeps the local and global structure of data. It is also easy to use with most libraries. UMAP can handle non-linear data very well. It works in low-dimensional space. UMAP helps in visualizing clusters. It is also scalable and flexible.
| Criteria | UMAP | t-SNE |
|---|---|---|
| Speed | Faster | Slower |
| Scalability | Better with large data | Not scalable |
| Preserving Structure | Local and global | Mostly local |
| Ease of Use | Easy | Complex |
Feature Selection Vs. Feature Extraction
Feature selection keeps the original features. It removes less important ones. This method is simple and fast. Feature extraction creates new features. These new features are combinations of the original ones. This method is more complex but can improve performance. Both methods aim to reduce data size. Smaller data size helps in faster processing. Choose based on your data and needs.
Both methods can boost model performance. Feature selection improves model accuracy by removing noise. Feature extraction can make patterns clearer. Clearer patterns help models learn better. Sometimes, feature extraction can outperform feature selection. This happens when new features capture more information. Always test both methods. The best method depends on your specific data.
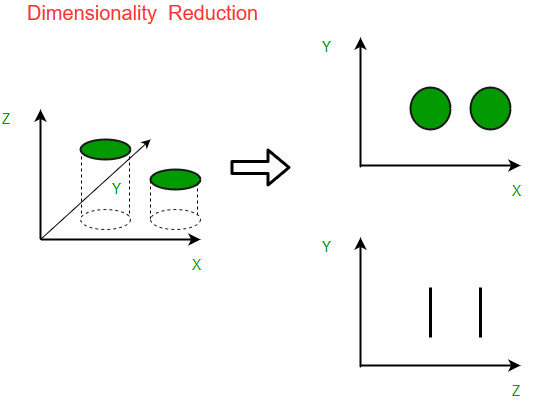
Credit: www.geeksforgeeks.org
Implementing Dimensionality Reduction
Dimensionality reduction helps in making data easier to understand. Start by normalizing data. This makes sure all features have the same scale. Principal Component Analysis (PCA) is popular for reducing dimensions. Feature selection is another key technique. Choose features that add the most value. Always visualize data before and after reduction. This helps in understanding the impact of reduction.
Use Python for dimensionality reduction. Scikit-Learn offers many tools for this. PCA and t-SNE are both available in Scikit-Learn. NumPy and Pandas help in data preparation. Matplotlib and Seaborn are great for data visualization. TensorFlow and PyTorch also have tools for dimensionality reduction.
Case Studies And Real-world Applications
Dimensionality reduction helps in reducing computational costs. Large datasets often slow down computers. By using these methods, processing speed increases. This makes data analysis much faster and more efficient. Machine learning models also benefit from smaller datasets. They train faster and perform better.
Dimensionality reduction helps in creating clearer visualizations. High-dimensional data is hard to visualize. Reducing dimensions simplifies this task. Patterns and trends become more visible. This aids in better understanding the data. Graphs and charts become easier to read. This helps in making informed decisions.

Credit: towardsdatascience.com
Challenges And Considerations
Reducing dimensions may lead to data loss. Important features might get removed. This can impact the model’s performance. Careful selection of features is necessary. Use techniques that preserve critical information. Avoid removing key data points.
Model accuracy might drop with reduced dimensions. Ensuring high accuracy is crucial. Validation and testing are essential steps. Use cross-validation techniques. Compare the reduced model with the original. Monitor performance metrics closely. Adjust methods to retain accuracy.
The Future Of Dimensionality Reduction
New techniques in dimensionality reduction are changing data analytics. These methods help manage big data better. Autoencoders are one such technique. They use neural networks to reduce dimensions. Another method is t-SNE. It makes high-dimensional data easy to visualize. UMAP is also gaining popularity. It provides faster and more accurate results.
More companies are using dimensionality reduction to analyze data. This trend will grow in the future. Machine learning tools will become more advanced. They will handle more complex data sets. Real-time data analysis will also become common. This will help businesses make faster decisions. Cloud-based solutions will offer scalable options for data storage and processing.
Frequently Asked Questions
What Are 3 Ways Of Reducing Dimensionality?
1. Apply Principal Component Analysis (PCA) to transform and reduce dimensions. 2. Use Feature Selection to choose the most relevant features. 3. Implement t-Distributed Stochastic Neighbor Embedding (t-SNE) for dimensionality reduction in visualization.
What Is The Pca Reduction Method?
PCA, or Principal Component Analysis, reduces data dimensions. It transforms variables into a smaller set of uncorrelated components. This simplifies data while retaining essential information, improving analysis and visualization.
What Is An Example Of Dimensionality Reduction?
Principal Component Analysis (PCA) is a common example of dimensionality reduction. It reduces data dimensions while preserving variance.
Which Is The Popular Method For Dimensionality Reduction?
Principal Component Analysis (PCA) is the most popular method for dimensionality reduction. It transforms data into fewer dimensions.
Conclusion
Mastering dimensionality reduction methods can significantly enhance your data analysis skills. These techniques simplify complex datasets, improving both efficiency and accuracy. By applying the right method, you unlock hidden patterns and insights. Stay updated with the latest advancements to continually refine your approach.
Your expertise in this area will drive better data-driven decisions.

