Master key statistical tests for EDA using Python. Learn when and how to apply t-tests, ANOVA, chi-square, and more. Enhance your data analysis toolkit and make data-driven decisions confidently.
Exploratory Data Analysis (EDA) is a crucial step in understanding datasets before diving into further analysis. In Python, various statistical tests can be utilized to gain insights into the data’s distribution, relationships, and outliers. By employing t-tests, ANOVA, and chi-square tests, data analysts can confidently draw meaningful conclusions and make informed decisions based on statistical significance.
These tests serve as powerful tools to validate assumptions, explore correlations, and uncover hidden patterns within the data. In this blog, we will delve into the significance of these statistical tests in EDA and how they can be implemented using Python libraries.

Credit: www.analyticsvidhya.com
Setting Up Python Environment
Before diving into statistical tests for Exploratory Data Analysis (EDA) in Python, you need to set up your Python environment. This involves installing essential libraries and importing necessary packages. Follow this guide to get started quickly.
Installing Libraries
To perform statistical tests, you need specific libraries. The most commonly used libraries are pandas, numpy, scipy, and matplotlib. You can install them using pip.
Open your terminal or command prompt and run these commands:
pip install pandas
pip install numpy
pip install scipy
pip install matplotlib
These commands will download and install the required libraries. Make sure you have a stable internet connection.
Importing Necessary Packages
Once the libraries are installed, you need to import them in your Python script. Open your Python IDE or Jupyter Notebook and add the following code:
import pandas as pd
import numpy as np
import scipy.stats as stats
import matplotlib.pyplot as plt
This code imports the libraries with common aliases. Using aliases makes the code easier to read and write.
Here is a table summarizing the libraries and their uses:
| Library | Alias | Use |
|---|---|---|
| Pandas | pd | Data Manipulation |
| Numpy | np | Numerical Operations |
| Scipy | stats | Statistical Tests |
| Matplotlib | plt | Data Visualization |
With these libraries installed and imported, you are ready to perform statistical tests for EDA in Python. This setup ensures smooth execution of your Python scripts.
Descriptive Statistics
Descriptive statistics summarize data in a meaningful way. They help you understand the basic features of your dataset. This section covers common descriptive statistics used in Exploratory Data Analysis (EDA) in Python.
Mean
The mean is the average of all data points. It is calculated by summing all values and dividing by the number of values.
import numpy as np

data = [1, 2, 3, 4, 5]
mean = np.mean(data)
print(mean)
The mean provides a central value for the data.
Median
The median is the middle value in a data set. If the data has an even number of values, the median is the average of the two middle numbers.
median = np.median(data)
print(median)
The median is less affected by outliers.
Mode
The mode is the value that appears most frequently in the dataset.
from scipy import stats

mode = stats.mode(data)
print(mode)
The mode helps identify the most common value.
Variance And Standard Deviation
Variance measures how far each number in the set is from the mean. The standard deviation is the square root of variance. It shows the spread of data around the mean.
variance = np.var(data)
std_dev = np.std(data)
print(variance)
print(std_dev)
Lower values indicate that data points are close to the mean. Higher values indicate that data points are spread out.
Normality Tests
In Exploratory Data Analysis (EDA), checking for data normality is essential. Normality tests help determine if data follows a normal distribution. This is crucial for many statistical methods and models. Below, we’ll discuss two popular normality tests in Python.
Shapiro-wilk Test
The Shapiro-Wilk Test checks if data is normally distributed. It is effective for small datasets. The test returns two values: the test statistic and the p-value. A p-value less than 0.05 indicates non-normality.
Here’s how you can perform the Shapiro-Wilk Test in Python:
import scipy.stats as stats

data = [1.23, 2.34, 3.45, 4.56, 5.67]
stat, p = stats.shapiro(data)

print('Statistics=%.3f, p=%.3f' % (stat, p))
Interpretation: If p < 0.05, the data is not normally distributed.
Kolmogorov-smirnov Test
The Kolmogorov-Smirnov Test compares the sample data with a normal distribution. It is suitable for larger datasets. The test outputs a test statistic and a p-value. A p-value less than 0.05 suggests non-normality.
Performing the Kolmogorov-Smirnov Test in Python is straightforward:
import scipy.stats as stats

data = [1.23, 2.34, 3.45, 4.56, 5.67]
stat, p = stats.kstest(data, 'norm')

print('Statistics=%.3f, p=%.3f' % (stat, p))
Interpretation: If p < 0.05, the data is not normally distributed.
| Test | Dataset Size | Interpretation |
|---|---|---|
| Shapiro-Wilk | Small | If p < 0.05, data is not normal |
| Kolmogorov-Smirnov | Large | If p < 0.05, data is not normal |
Both tests are easy to implement in Python using the scipy.stats library. They provide valuable insights into the normality of your data. Use them to ensure the accuracy of your EDA and subsequent analyses.

Credit: towardsdatascience.com
Correlation Tests
Correlation tests help identify relationships between variables. In Python, these tests are crucial for Exploratory Data Analysis (EDA). They reveal if changes in one variable affect another. Here, we’ll explore two primary correlation tests: Pearson Correlation and Spearman Correlation.
Pearson Correlation
Pearson Correlation measures the linear relationship between variables. It ranges from -1 to 1. A value of 1 means a perfect positive relationship. A value of -1 indicates a perfect negative relationship. A value of 0 shows no linear relationship.
To use Pearson Correlation in Python, you can use the `scipy.stats` library. Here’s a simple example:
import numpy as np
from scipy.stats import pearsonr

# Sample data
x = np.array([1, 2, 3, 4, 5])
y = np.array([2, 3, 4, 5, 6])

# Calculate Pearson correlation
corr, _ = pearsonr(x, y)
print(f"Pearson correlation: {corr}")
Spearman Correlation
Spearman Correlation evaluates the monotonic relationship between variables. It doesn’t assume a linear relationship. It ranges from -1 to 1, similar to Pearson.
Spearman is useful when data isn’t normally distributed. Here’s how to calculate it in Python:
import numpy as np
from scipy.stats import spearmanr

# Sample data
x = np.array([1, 2, 3, 4, 5])
y = np.array([2, 3, 4, 5, 6])

# Calculate Spearman correlation
corr, _ = spearmanr(x, y)
print(f"Spearman correlation: {corr}")
| Correlation Test | Type | Range | Use Case |
|---|---|---|---|
| Pearson Correlation | Linear | -1 to 1 | Normally distributed data |
| Spearman Correlation | Monotonic | -1 to 1 | Non-linear data |
Both tests are essential tools in EDA. They provide insights into variable relationships. Using them effectively can enhance your data analysis.
Hypothesis Testing
Hypothesis Testing is a fundamental aspect of Exploratory Data Analysis (EDA) in Python. It helps you make decisions about your data. By using different statistical tests, you can check assumptions and relationships in your data. Let’s explore two common tests: the T-Test and the Chi-Square Test.
T-test
The T-Test assesses if two groups have different average values. It is useful for comparing the means of two samples. There are three types of T-Tests:
- One-sample T-Test: Compares the sample mean to a known value.
- Independent two-sample T-Test: Compares the means of two independent groups.
- Paired sample T-Test: Compares means from the same group at different times.
Here is a simple code example for an Independent two-sample T-Test:
import scipy.stats as stats

# Sample data
group1 = [20, 22, 19, 24, 23]
group2 = [30, 28, 27, 29, 26]

# Perform T-Test
t_stat, p_val = stats.ttest_ind(group1, group2)

print(f'T-Statistic: {t_stat}, P-Value: {p_val}')
Chi-square Test
The Chi-Square Test evaluates if there is an association between categorical variables. It is often used in contingency tables to assess relationships. This test is ideal for checking the independence of two variables.
Steps for performing a Chi-Square Test:
- Set up a contingency table.
- Calculate the expected frequencies.
- Compute the Chi-Square statistic.
- Compare the statistic to a critical value from the Chi-Square distribution.
Here is a simple code example for a Chi-Square Test:
import scipy.stats as stats
import numpy as np

# Contingency table
data = np.array([[10, 20, 30], [6, 9, 17]])

# Perform Chi-Square Test
chi2_stat, p_val, dof, expected = stats.chi2_contingency(data)

print(f'Chi-Square Statistic: {chi2_stat}, P-Value: {p_val}')
Both the T-Test and Chi-Square Test are powerful tools in EDA. These tests help validate your data assumptions.

Credit: www.kaggle.com
Anova
Analysis of Variance (ANOVA) is a powerful statistical test. It helps to analyze the differences among group means. ANOVA is widely used in exploratory data analysis (EDA) in Python. In this section, we will cover One-Way ANOVA and Two-Way ANOVA.
One-way Anova
One-Way ANOVA compares means of three or more groups. It determines if at least one group mean is different. Here is how you can perform One-Way ANOVA in Python:
from scipy.stats import f_oneway

# Sample data
group1 = [23, 45, 56, 67, 78]
group2 = [34, 56, 78, 89, 90]
group3 = [45, 67, 78, 89, 100]

# Perform One-Way ANOVA
f_stat, p_value = f_oneway(group1, group2, group3)
print(f'Statistic: {f_stat}, P-Value: {p_value}')
The result includes the F-statistic and the P-Value. A low P-Value suggests a significant difference between group means.
Two-way Anova
Two-Way ANOVA examines the influence of two different categorical variables on one continuous variable. It also investigates the interaction between the two variables. Below is an example using Python:
import pandas as pd
import statsmodels.api as sm
from statsmodels.formula.api import ols

# Sample data
data = {'Score': [23, 45, 56, 67, 78, 34, 56, 78, 89, 90, 45, 67, 78, 89, 100],
        'Group': ['A', 'A', 'A', 'A', 'A', 'B', 'B', 'B', 'B', 'B', 'C', 'C', 'C', 'C', 'C'],
        'Treatment': ['X', 'Y', 'Z', 'X', 'Y', 'Z', 'X', 'Y', 'Z', 'X', 'Y', 'Z', 'X', 'Y', 'Z']}
df = pd.DataFrame(data)

# Perform Two-Way ANOVA
model = ols('Score ~ C(Group) + C(Treatment) + C(Group):C(Treatment)', data=df).fit()
anova_table = sm.stats.anova_lm(model, typ=2)
print(anova_table)
The table shows the effects of each factor and their interaction on the dependent variable. A significant interaction means the effect of one factor depends on the level of the other factor.
Visualization Techniques
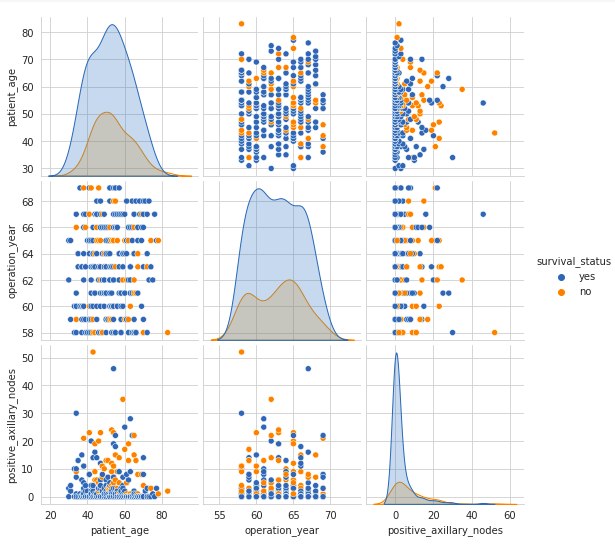
Visualization Techniques play a crucial role in Exploratory Data Analysis (EDA) to uncover insights from data. In Python, various statistical tests can be visually represented using different visualization methods.
Box Plots
Box plots are useful for displaying the distribution, central tendency, and variability of a dataset.
Histograms
Histograms provide a visual representation of the distribution of a continuous variable.
Frequently Asked Questions
How Is A T-test Useful For Eda In Python?
A t-test helps identify significant differences between groups in EDA. It evaluates if means differ statistically. Python libraries like SciPy make it easy to perform t-tests. This aids in understanding data patterns and relationships, crucial for insightful analysis.
What Is Statistical Analysis In Eda?
Statistical analysis in EDA involves summarizing data, identifying patterns, and detecting anomalies. It uses descriptive statistics to understand data distributions.
What Are The Three Types Of Analysis In Eda?
The three types of analysis in EDA are univariate, bivariate, and multivariate. Univariate analysis examines one variable. Bivariate analysis explores relationships between two variables. Multivariate analysis assesses interactions among three or more variables.
How Do You Analyze Eda?
To analyze EDA, use statistical summaries, visualizations, and correlation matrices. Identify patterns, outliers, and data distributions.
Conclusion
Mastering statistical tests for EDA in Python enhances data analysis skills. These tests uncover hidden patterns and insights. Utilize libraries like pandas, numpy, and scipy for efficient analysis. By leveraging these tools, you can make informed decisions based on solid data foundations.
Start exploring statistical tests today to elevate your data science projects.

