
Complex SQL Queries for Big Data: Mastering Data Analytics
Elevate your data science skills with advanced SQL techniques for big data. Learn complex querying, optimization, and data modeling. Enhance your analytics capabilities. Big data

Elevate your data science skills with advanced SQL techniques for big data. Learn complex querying, optimization, and data modeling. Enhance your analytics capabilities. Big data
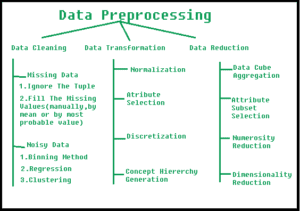
Ensure data quality in your science projects with SQL-based cleaning techniques. Learn to handle missing values, remove duplicates, and standardize formats. Improve analysis accuracy. Click

Want to turn raw data into powerful insights and drive better business outcomes? Learn how to create interactive dashboards using SQL, the backbone for querying and managing data stored in databases. This step-by-step guide shows you how to transform data into compelling visual stories, enabling you to communicate insights effectively. Integrating SQL with visualization tools like Tableau or Power BI enhances the user experience, enabling drill-down into data, identifying trends, and making informed decisions quickly. Don’t miss out on this opportunity to enhance your data visualization skills and build robust, interactive dashboards that deliver results.
Looking to take your data science skills to the next level? Learn how to build ELT pipelines with SQL for seamless data integration and efficient analysis. With SQL, you can easily extract raw data from various sources, transform it into usable formats, and load it into a centralized data warehouse. By automating these processes, you’ll save time and improve data accuracy, resulting in more informed decision-making. We’ll take you through the core components of ELT, the best SQL tools for the job, and even give real-world examples of how major companies use ELT pipelines to process large datasets. Delve into the world of ELT pipelines today and stay ahead in data science.

Unlock insights from your time series data with our expert guide to EDA techniques. Learn how to visualize trends, detect anomalies, and prepare your data

Harness the power of SQL for statistical analysis in data science. Learn to calculate averages, variances, correlations, and more. Streamline your workflow and gain deeper

Boost your machine learning model performance with effective EDA-based feature selection. Learn to identify relevant variables, reduce dimensionality, and improve model accuracy. Enhance your ML

Find the perfect EDA tool for your data science projects. We compare features, pricing, and user experiences of top EDA software. Make an informed decision
Discover the top Python libraries that will streamline your NLP workflows. Compare NLTK, spaCy, and Gensim features. Boost your productivity and enhance your data science